features · Jul 27, 2025
Introducing Charts in Quire: Translate Data into Actions

Tired of sifting through endless numbers to understand project progress? Quire's latest addition Charts transform your raw project information into colorful, easy-to-understand visuals, right where you work. We believe that managing projects visually makes all the difference, giving you instant insights into trends and ratios.
Beyond our existing reporting options, you can now create customized charts that are unique to your team's needs. Need to see specific sales metrics, marketing campaign performance, or detailed development cycles? Simply build the reports that matter most to you. Plus, you can even turn your Quire Document into dynamic, visual reporting dashboards, leveraging the data already in your projects.
Get a clear, visual grip on what matters most. Quire Charts help you streamline your workflow and make more informed decisions through powerful, customizable visual reporting.
Chart is made for Professional and higher subscription tiers. More information can be found on our Pricing page.
How to Get Started with Quire Charts?

- In any Quire Document and Description, you can type
/Chartto get add your first chart to your canvas. - Choose where to pull the data from, whether it is from the entire project, or from a specific sublist if you already created earlier.
- Select the chart type.
- Choose the values that need to create your chart.
For a step-by-step guide on how to best utilize Quire Charts, please visit our guide.

Want to visualize your Quire data in a unique way? You can by adding custom fields to your task list and then pulling those data values into your charts. Just remember that only custom fields containing numerical values can be charted.
Feeling adventurous? You can even create formulas within Quire to combine your raw data, offering even more insightful visualizations on your charts.
For some charting inspiration, check out our Templates page. We're continuously adding new templates to help you get started!
What Kinds of Charts Can You Create?
We didn’t just give you a single pie and call it a day. With Quire Charts, you get a full buffet of visualizations to help you understand your project data from every angle, whether you’re looking at progress, performance, or time spent. Here’s a closer look at what’s on the menu:
🟦 Line Charts

Want to track how your project changes over time? Line charts are perfect for showing trends based on task status counts. Use them to visualize how your project’s statuses - like "To Do," "In Progress," or "Completed" - evolve over time. It’s a great way to spot momentum shifts and forecast your upcoming workload.
🟩 Area Charts

Area charts offer a similar view like line charts, but with a bit more emphasis on volume. They’re great for stacking multiple datasets, such as visualizing how different departments contribute to a project over time, or how each team member logs hours week-by-week. The shaded area gives you a stronger visual impact, making patterns pop.
🟧 Bar Charts

Need a quick comparison between categories? Bar charts are your go-to. Whether you’re comparing tasks with due per week by different assignees, task counts by project tags, or completed tasks across teams, bars make it super easy to spot the highs, lows, and everything in between.
🟨 Pie & Donut Charts

Sometimes, you just need to break things down into digestible pieces. Pie and donut charts are great for showing proportions, like how tasks are distributed by status (e.g., 40% done, 30% in progress), or how time is divided between categories. Donut charts add a little visual flair and more room in the center for labels or values.
🟪 Nested Donut Charts
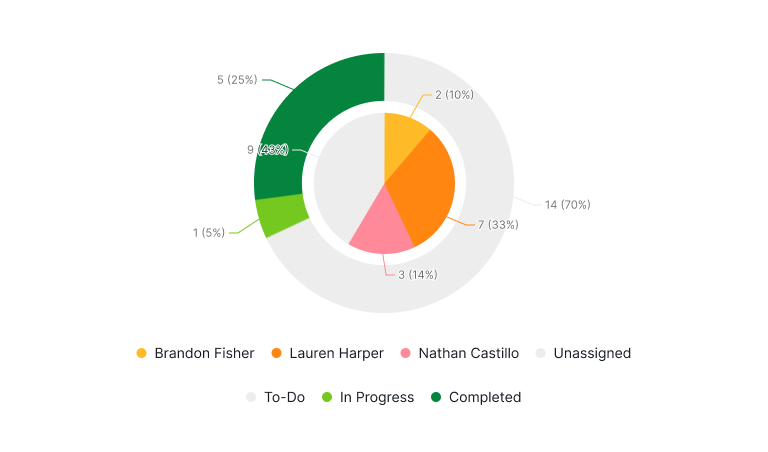
This is where things get fancy. A Nested Donut Chart lets you visualize data with multiple layers. Think of it as a zoom-in on structure: outer rings for due dates, inner rings for assignees. Or use it to group time logs by project and sub-project. It’s a powerful way to see how work is structured and progressing in a more hierarchical or grouped context.
What Can You Chart, Exactly?
You’re probably wondering what kind of data can be visualized. The short answer? Pretty much everything related to your tasks and team activities. Here are some popular use cases:
1. Task Status Breakdown
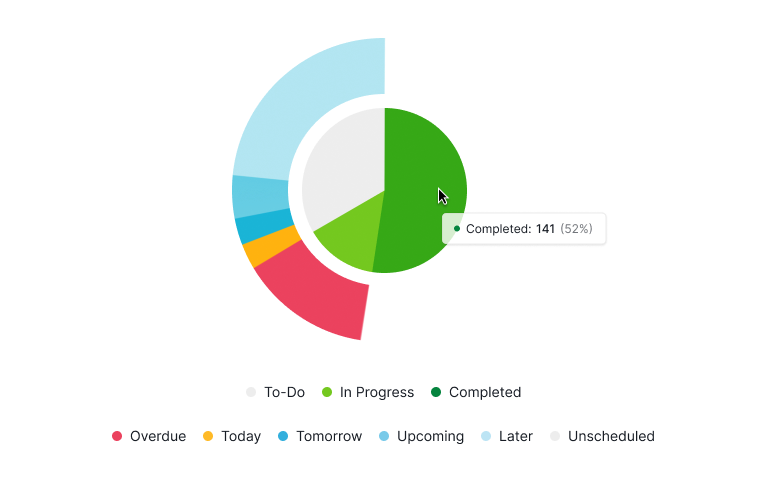
Get a clear picture of your project health with a chart showing how many tasks are in each status: Done, In Progress, Approval, Request Approval etc. You’ll know in seconds if your team is on track or stuck.
2. Task Progress Over Time
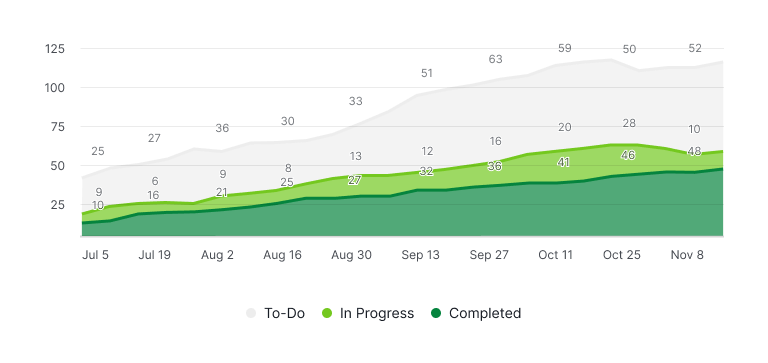
Track how your project is moving day-by-day or week-by-week. You can use this to compare planned vs. actual progress, identify bottlenecks, or celebrate milestones.
3. Time Logs

Time logs charts give you a clear view of how much time is spent on billable vs. non-billable tasks. They’re perfect for tracking productivity, managing resources, and making sure your team's time is used effectively.
4. Timesheets

Timesheet charts focus on each team member’s logged hours, making it easy to see who’s working on what and how time is distributed across the team. It's a great way to monitor individual workloads and ensure balanced contributions.
Customize, Filter, and Group to Your Heart’s Content

Charts in Quire aren’t just static images - they’re interactive and customizable. You can:
- Filter by date range, assignee, task status, tag, or project
- Group data by different criteria (like by user, project, or tag)
- Choose how your data is measured - by task count, total hours, or estimate hours
Whether you're looking for the big picture or digging into the weeds, Quire Charts helps you make better decisions, faster. No spreadsheets, no complicated setup - just clear, real-time insights at your fingertips.
How Sales Team Uses Charts: Tracking Weekly Outreach with a Bar Chart

Let’s say your Sales team is on a mission to close new deals. This stacked Bar Chart is a great example of how a sales team can track their monthly outreach and progress across different sales stages.
Each bar represents a month, with color-coded segments showing the number of opportunities at each stage - like “Inquiry Requested,” “Meeting Planned,” “Proposal Delivered,” and so on. It helps the team quickly assess where most efforts are concentrated, spot trends like an increase in “New Success” or “Churn,” and make informed decisions to improve future performance.
How Marketing Team Uses Charts: Measuring Campaign Impact with a Pie Chart

The Marketing team just wrapped up a social media campaign, a newsletter, and a webinar—all in the same week (yes, they’re superheroes). But which effort drove the most traction?
With Pie Charts, they can group completed tasks by tag (like #approved, #design, #review), and instantly compare task completion count, time spent, or even task duration. It’s a quick way to evaluate campaign ROI without pulling out spreadsheets.
They can also track Task Status Breakdown using a Donut Chart, giving the team a colorful look at what’s done, what’s in progress, and what’s still sitting on someone’s to-do list.
How Developer Team Uses Charts: Visualizing Team Effort using Bar Charts

Developers often work under pressure, and quickly understanding the status of a project is crucial for the entire team. The new Bar Chart is an ideal tool for this.
Say your dev team is mid-sprint. They need to know the estimated time log for each member in the team to spot roadblocks and intervene when needed. They can track the hours spent on tasks for each member in the team, without pulling out the excel file.
It’s All Live, It’s All Yours
Charts in Quire are dynamic - so whenever your data updates, your visuals do too. You can customize, filter, and save the ones that matter most to your team. And yes, you can download them as images to include in reports, slides, or just to show off a little.
No more guessing. No more static reports. Just clear, visual insights into your team’s work, ready when you are.