Is there a way to have the stats of the tasks done per day, per projects/tags? Can eventually the logs from the tasks/projects be expose through API so we can do the stats we need?
a heatmap would be awesome!
Charlotte R, Mar 26, 2021
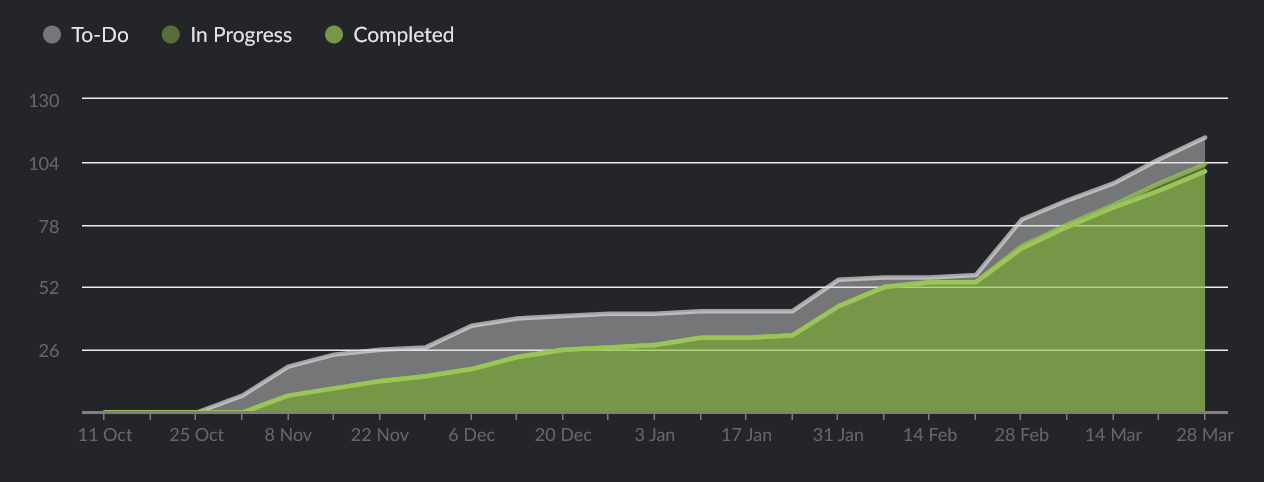
Hi @JP-89 In our current Project Overview page, you can see how many tasks are completed in the Progress Stats.
- Click to hide the stats for the other columns.
- Hover over the chart to see the tasks completed each day.
- Drag to zoom in to a specific range on the chart.
I hope this is helpful to what you are looking for.
![[feedback] progress stats.gif](/aup/Co/1Kb83-tgnPt8u9IS5XmzI.x4/ft1ocv3t/%5Bfeedback%5D%20progress%20stats.gif)
Peggy, Mar 15, 2021
@peggy Thanks for the response and sorry for not noticing it sooner. I'm using the overview page and it's cool to have those statistics. For me I usually add and complete tasks in the same frequency. So Todo and Completed lines increase in parallel and don't give me a sense of accomplishment, which is what I seek a graph for.
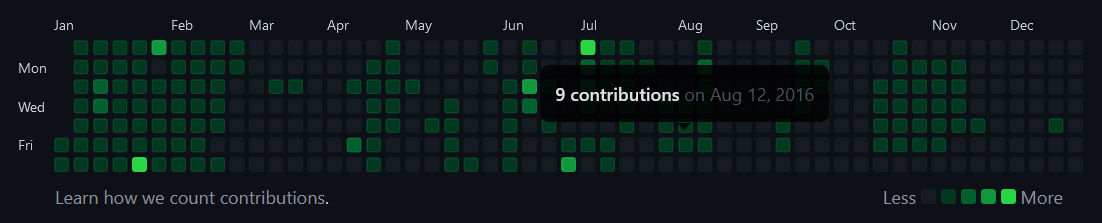
Following I added an example of the github statistic I mentioned earlier. What I like about it is: I can look back and say "I did a lot last week, all days are green" or "I've been lazy last month, there are a lot of empty days".
JP, Mar 26, 2021
Hi @JP-89 and @CharlotteR - I have passed your suggestion to our team!
Thank you @JP-89 especially for sharing the screenshots! Like I have mentioned before, it's definitely in our consideration to make enhancements to our Overview page in the future. If we make progress about this feature, I will let you know in this thread. Thanks again!
Peggy, Mar 30, 2021
Tasks done per day in displayed in a graphical way would be really cool. I imagine something like github's contributions per day of year display on the profile page
JP, Mar 13, 2021
Hi @boangiu - Thanks for your feedback. Right now, you won't be able to filter the stats in our Overview page. The stats and summary are only shown in Weekly summary in our project overview page. (See the guide here: https://quire.io/guide/project-overview/)
However, it's in our consideration to make some enhancements for our Overview page. We are still at the stage of gathering some feedback and suggestions from our users and understanding what they would like to see in the project/organization reports. If you have any other ideas or data you would like to see, please let us know in the below comments. Thanks for your help!
p.s. I have also slightly edited the title of this feedback, so other users with similar feedback can find this thread and add their votes or comments here as well. 😜
Peggy, Dec 18, 2020
I would want to see the number of tasks completed group by tags.
mirela_boangiu, Dec 28, 2020