productivity tips · Feb 1, 2016
Turn Your Projects into Customizable Reports in Excel
Quire projects export to CSV, which opens cleanly in Microsoft Excel or Google Sheets with task name, priority, tag, due date, assignee, and description laid out in columns. From there, managers can apply colors, filters, sorts, and grouping to build custom reports that mirror Quire's task and subtask hierarchy. The result is a shareable, spreadsheet-native view of any project.
They say old habits die hard. So we get that some of you, or your managers, are used to the flexibility of customizing your own reports in a software application you’re already familiar with: Microsoft Excel or Google Sheets.
When it comes to that, you can export your projects into CSV formatted files on Quire.
Need to go the other direction? Read more on bringing spreadsheet data back into Quire with copy-paste import.
For example, you and your team members are working on an animated video for a client.
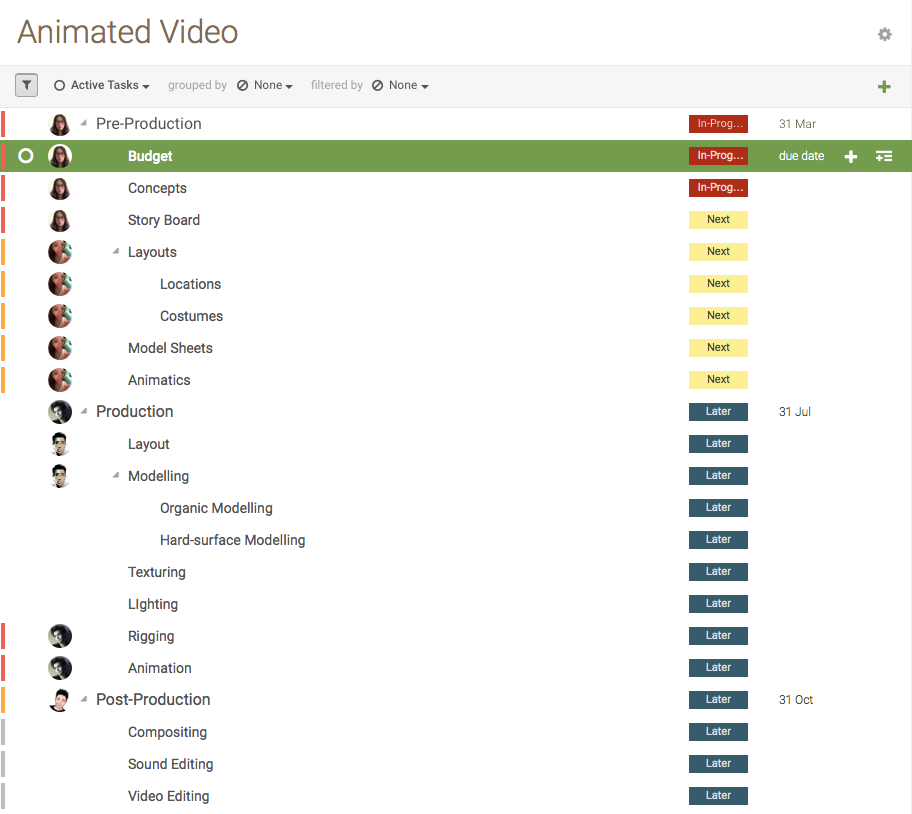
After choosing export to CSV, you’ll get a CSV file.
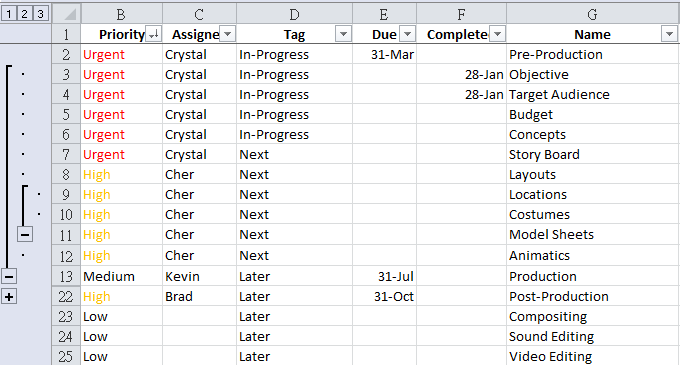
With the CSV file, you can open it with Excel, Google Sheets or whatever spreadsheet application you prefer, where you’ll see a report with all the project information, including task name, priority, tag, due date, assignee and description, nicely laid out in rows and columns.
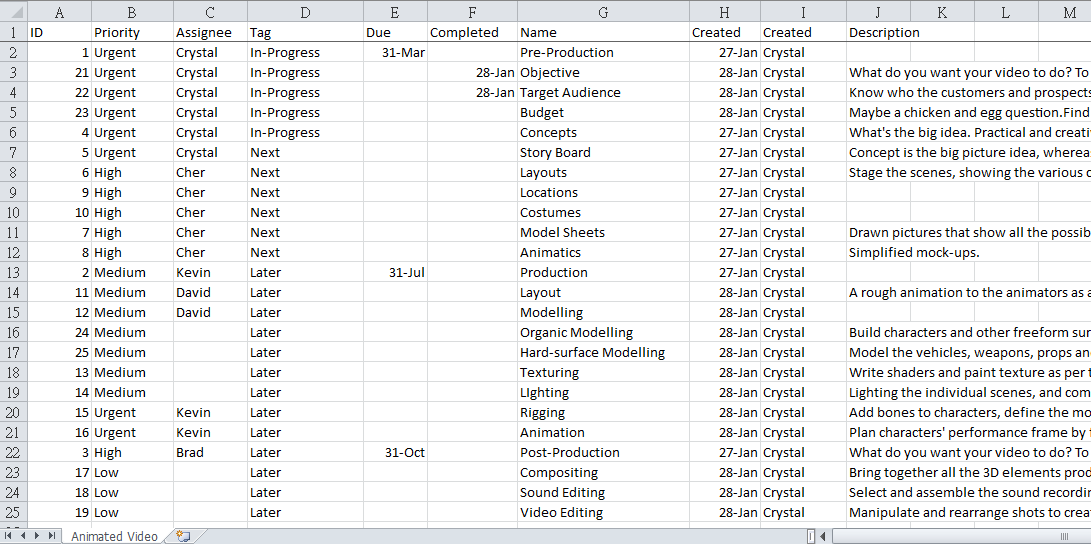
Based on this report, you can customize it, like adding colors, and also filters and sorts.
Once you’ve done so, you can see a visual overview of your report, and choose how you’ll see the information that matters to you, i.e., items that have been assigned, have priority Urgent and High, and without the descriptions.
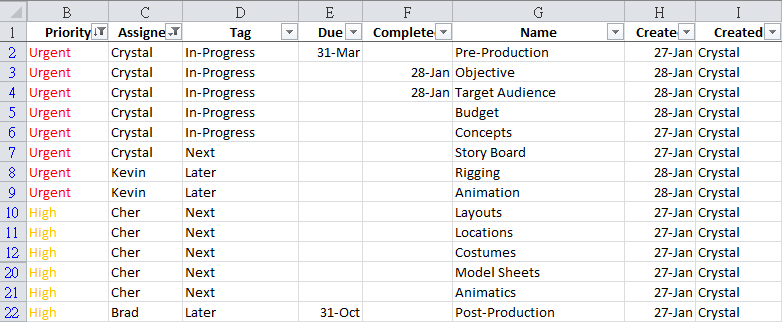
You can also group (sort) the items and sub-items, expand or collapse them, similar to how you’d have done with the tasks and subtasks in your Quire project.
See, easy as pie.
If you'd rather skip the export step entirely, Quire's own Table View gives you the same spreadsheet-style columns, filters, and custom fields natively, and Insight View turns that data into charts without ever leaving Quire.
For all the Excel whizs out there, you now know a way to customize your own-styled report in spreadsheet softwares like Microsoft Excel and Google Sheets, and share it with your team members!
Frequently Asked Questions
Can I export a Quire project to Excel or Google Sheets?
Yes. Quire projects export to CSV, which opens cleanly in Excel, Google Sheets, or any spreadsheet app you prefer.
What information appears in a Quire CSV export?
Task name, priority, tag, due date, assignee, and description, with each task as one row in the spreadsheet.
How do I export a Quire project as a CSV file?
Open the project in Quire, choose export to CSV, then open the downloaded file in Excel or Google Sheets.
Can I customize the look of my exported Quire report?
Yes. Once it's open in a spreadsheet, add colors, filters, and sorts to highlight what matters, like Urgent and High priority items.
Does the export preserve Quire's task and subtask hierarchy?
Yes. You can group and expand or collapse items and sub-items in the spreadsheet, just like tasks and subtasks in Quire.