features · Jan 14, 2021
Introducing Dynamic Timeline: Illustrate Team Schedule and Achieve Success
Last updated: July 30, 2026
Quire's Dynamic Timeline is a Gantt chart that doesn't drown you in toolbars. Switch any project to Timeline view, drag tasks to reschedule, color-code by priority or tag, and group by assignee to spot workload imbalance. The nested task list stays visible on the left (because most Gantt tools force you to give it up). Available on projects, My Tasks, and Smart Folder.
- Traditional Gantt chart vs. Quire's Dynamic Timeline: what's the difference?
- What is a project timeline and why does your team need one?
- How does Quire Timeline simplify workload management?
- How does the Quire team plan with Timeline? 🚀
- What are the most common mistakes when using a Gantt chart?
- When is Timeline not the right view for your project?
- Key takeaways
- Frequently Asked Questions
- Ready to plan your team's work on a real timeline? 🏆
If you've been with Quire from day one, we can imagine how excited you are to see the title of this blog post. Finally, the long-awaited Gantt Chart, also known as Timeline, has made its first debut.
We’ve spent time discussing and developing a Timeline feature that actually helps you manage your projects in the most efficient and easiest way possible, instead of freaking you out with all the complexities of a traditional Gantt Chart.
A lot of trials and errors have been made and today, we’re proud to introduce the Dynamic Timeline feature to you.
Timeline also works on My Tasks and on Smart Folders. Because a Smart Folder gathers tasks from across several projects, putting it in Timeline view gives you one schedule spanning all of them, which is where you actually see two projects quietly booking the same person for the same fortnight.
Traditional Gantt chart vs. Quire's Dynamic Timeline: what's the difference?
Most Gantt tools assume you want a full air-traffic-control panel. Quire's Timeline assumes you want to see the schedule and get on with your day. Here's the difference, side by side.
The general rule: a Gantt chart should answer your questions without making you build it first. Most don't. Quire's Timeline starts useful on day one.
What is a project timeline and why does your team need one?
Timeline (Gantt Chart) was born to answer three critical questions to project management:
Who is responsible for the tasks?
How long will these tasks last?
Which tasks should be prioritized first?
The traditional Gantt chart is a horizontal bar chart that illustrates a project schedule. Each bar in a Gantt chart represents a task in the project timeline and the length of the bar visualizes the time duration for completing the task.
Since all of the tasks are laid out in a calendar-like view, managers can get the bird’s eye picture of the current project status. A classic Gantt chart will show the task list timeline, start and end dates for the project, task dependencies, along with the responsible assignees.
However, since a Gantt chart can include much information in order to present as detailed messages as possible, users tend to feel overwhelmed and end up being clueless and even more confused.
That’s the main reason why it took our team so long to finally figure out a Timeline that is intuitive enough to get you started and powerful enough to keep up with your challenging projects.
How does Quire Timeline simplify workload management?
1. Schedule project agenda and plan ahead to stay prepared
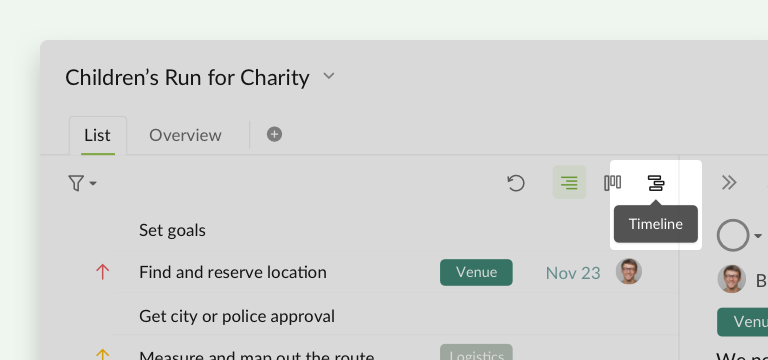
On the upper right corner, before switching your project view to Quire's Dynamic Timeline, make sure you have added start and due dates for your tasks. If you haven’t decided the schedule for your tasks yet, you can simply drag and arrange the timespan for completing the tasks.
Any project and its sublists can easily switch among Tree view, Board view and Timeline view.
With the Timeline view, each task will be mapping out its time duration. The Timeline is best to forecast the project that you’re working on to see if there’s any timing conflict or if your team is on track to meet the deadlines. You can easily drag to reschedule the time duration of the tasks for as long as they should take.
2. Stay in context with Nested Task List and Timeline
If you google “project management software with Timeline/Gantt Chart feature”, the results will drive you crazy. We don’t want to create another software with the same feature, just a different layout.
When you switch your list to Timeline view, we let you keep the nested task list in the left side and present the project timeline in the right hand side. Unlike other project management software, once you switch to Gantt view, you have to give up your list view. We understand a project context is essential for team members to execute and manage the tasks.
To better visualize the project, you can set colors to your tasks either by priority, tag or date. Many studies have shown that colors can make significant differences to how much you are willing to get started on the tasks.
The dot in the right hand side of the task name indicates the task color and you can hover over the dot to see the due date of the task. And if you click on the dot, it will bring you right to the task that you’re viewing in Timeline!
3. Monitor project resources and availability
Let’s say you’re working on a project with 10 more members and some of them are clearly falling behind the schedule. However, with a clear project timeline, managers or supervisors can immediately spot the obstacles that block the team success.
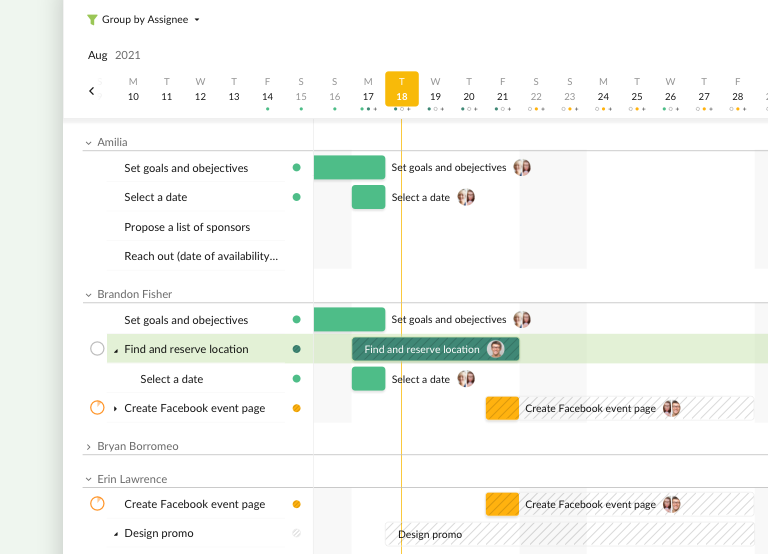
In the Timeline view, you can sort the tasks by Assignees and all of the tasks will be grouped by the assignees accordingly. With the tasks presented in the lane for each assignee, you can immediately know if the tasks are evenly distributed between team members, or need extra attention in order to meet the deadlines.
4. Customize Task List with Grid View
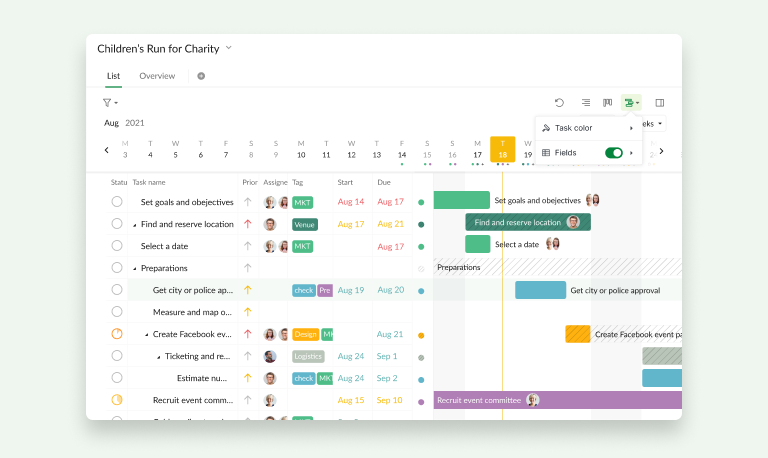
Since the timeline view can only show very limited details of the task list, you can tap on the timeline button and toggle on Fields.
You can choose which task details you would like to show on your list, the default selections are “Status”, “Priority”, “Assignee”, “Tags”, “Start”, and “Due”. After choosing which option you want to show, you can resize the column if needed.
How does the Quire team plan with Timeline? 🚀
1. Project Manager and Dev Team use Timeline for Product Launches
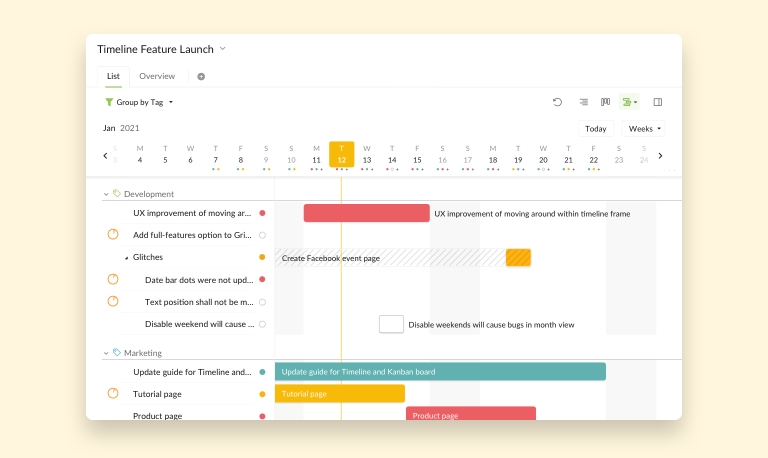
Before rolling out a new feature, it requires a long time of brainstorming and scheduling and making arrangements to available resources. Quire Project Manager Jim has been working side-by-side with the Head of Development Team to stay updated on the development process. Jim will use Timeline then group all the tasks by tags, so that he can have a bird's eye view of the project.
If there are sudden changes in the product and the Dev Team requires more time to work on the details, Project Manager has to rearrange the product readiness to ensure that the product roadmap will not get affected. Jim uses Timeline to spot roadblocks and forecast the duration of a feature development process.
2. Head of Human Resources uses Timeline for Event Planning
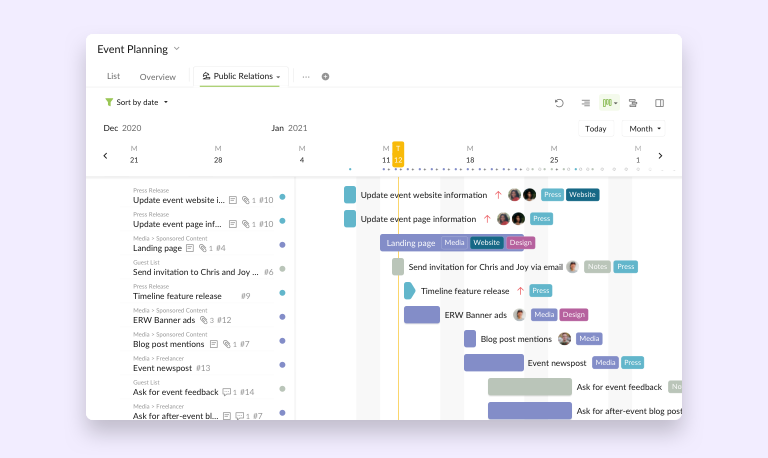
Penny is Quire’s Head of HR department. Her job is very stressful with thousands of deadlines and details to keep track of. She needs to make sure every due date is met - it’s not as easy as ticking off a task in your checklist.
Penny uses Timeline (Month view, sort by date, Advanced mode) to visualize the events that will be happening in the next couple of weeks. With all of the tasks presenting in a timeline view, Penny can make sure she can proactively manage the communications and spot any timing issues before they happen.
What are the most common mistakes when using a Gantt chart?
After watching teams adopt Quire Timeline (and the Gantt tools they came from), three patterns show up almost every time.
1. Putting every task on the timeline. The instinct on day one is to drag every single task onto the chart. By day three, the chart is unreadable and nobody opens it. Fix: only put tasks with real start and due dates on the timeline. Everything else stays on the task list until it earns a date.
2. Building dependencies before the work makes sense. Dependencies are powerful and they're also the fastest way to make a Gantt chart unmaintainable. Add the first two or three obvious ones (design has to finish before development starts), then stop. Add more only when a missed dependency actually costs you something on a real project.
3. Treating the Timeline as the source of truth for status. Status lives on the task. The Timeline shows you when work is happening, not whether it's done. Teams that try to use the chart as a status dashboard end up with two versions of reality, and the team stops trusting either one. Keep status on the task and let the Timeline do the scheduling work.
If you avoid those three, your Timeline will still be useful at month six. Most aren't.
When is Timeline not the right view for your project?
Three situations where you should pick a different Quire view instead. We'd rather flag this upfront than have you fight the view for a week.
- Your project is a backlog, not a schedule. If you have 200 tasks without start dates and no fixed deadlines, the Timeline will look empty. The Tree view (the default) is what you want. Move tasks onto the Timeline only when they've earned a date.
- You're managing recurring work, not project work. If your "project" is "marketing tasks for the rest of the year, but they happen in a loop," the Quire Calendar handles that pattern better. Timeline is for one-shot project work with start and end points.
- You're tracking small daily tasks, not deliverables. If your task is "reply to three emails before lunch," that's a checklist item, not a Timeline bar. Use the Board view or a simple checklist instead.
If your project has milestones, dependencies, and assignees with deadlines, Timeline is the right view. If it's anything else, save yourself the visual clutter and use a different view.
Key takeaways
- Quire's Dynamic Timeline is a Gantt view that keeps the nested task list visible on the left while the schedule sits on the right.
- Drag bars to reschedule without opening a task, and group by assignee to spot workload imbalance at a glance.
- It is available on projects, My Tasks, and Smart Folder, including the free plan (up to 35 members and 80 projects).
- Any project can switch between Tree, Board, and Timeline views at any time, since all three read the same underlying data.
Frequently Asked Questions
What is a Gantt chart in project management?
A horizontal bar chart that shows when each task starts, how long it takes, and how the tasks overlap. Modern Gantt tools (including Quire's Timeline) also show assignees, dependencies, and grouping in the same view.
How does Quire's Dynamic Timeline differ from a traditional Gantt chart?
The nested task list stays visible alongside the chart, you drag bars to reschedule without opening a task, and grouping by assignee or tag is one click. Setup is just adding start and due dates to your tasks. That's it.
Can you switch between Tree, Board, and Timeline views in Quire?
Yes. Any project, sublist, My Tasks, or Smart Folder can switch among Tree, Board, and Timeline at any time. Same data, different layout.
Does Quire Timeline support task dependencies?
Yes. Add the first two or three obvious ones (design before development), then stop. Add more only when a missed dependency actually costs you something on a real project.
Is Quire Timeline available on the free plan?
Yes. Timeline is available on every Quire plan including the free tier (up to 35 members and 80 projects), and it works on Smart Folders too, so one schedule can span several projects.
Ready to plan your team's work on a real timeline? 🏆
Timeline works for project managers, marketing coordinators, CEOs, and consultants. But really, it's for any team that needs to know when work is happening and who's holding it. Long-term complex project with a thousand tasks, short-term sprint with twenty, doesn't matter. The Timeline shape is the same.
If your team is working without a Timeline today, you're either holding the schedule in someone's head or rebuilding it every Monday in a separate doc. Both are expensive. Switch one in-flight project to Timeline view this week and see how it holds up.
P.S.: It's just the beginning of our Timeline work and there will be plenty more to explore. Leave a comment below or tweet us at @quire_io and tell us what you'd like to see next.
