project management · Jul 19, 2024
What Is a Kanban Chart? Types, Benefits, and How to Build One

Last updated: October 21, 2026
A Kanban chart visualizes work as cards moving across columns (To Do → In Progress → Done) so bottlenecks become obvious in real time. Four chart types cover different scales, basic Kanban for simple workflows, swimlane for complex projects, personal for individual work, and portfolio for managing multiple projects at once, and the five benefits compound: visibility, efficiency through WIP limits, flexibility, stronger collaboration, and continuous improvement.
- What is a Kanban Chart?
- How Does Kanban Chart Work in Project Management?
- What Are the 5 Benefits of Using a Kanban Chart?
- What Are the 4 Types of Kanban Charts?
- What's the Difference Between a Gantt Chart and a Kanban Chart?
- Create Your Kanban Chart in Quire
- Improve Your Project Management with Kanban Chart in Quire
- Frequently Asked Questions
Project management is a juggling act, with countless tools and methods vying for our attention. But one has risen above the rest in popularity: the Kanban chart, a method that traces back to the Toyota Production System.
This post covers how the Kanban chart works, its five benefits, the four chart types, and the comparison against Gantt charts that helps you pick the right view for the project.
What is a Kanban Chart?
Kanban chart: a visual view of work built from a Kanban board, where cards move across columns that represent the stages of a workflow. The name comes from the Japanese for signboard, and the chart's job is to make flow and bottlenecks visible at a glance rather than to schedule dates.
Build one in four moves: duplicate the Kanban Board template in Quire, rename the columns to your stages, and the chart is live before the next standup.
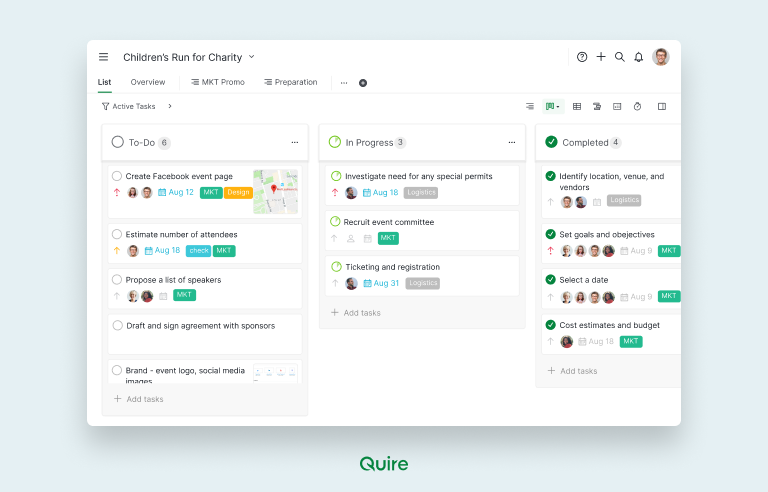
A Kanban chart exists to optimize workflow rather than to record a plan. Most are divided into three columns, To Do, In Progress and Done, with each task a card that moves across them as it progresses.
That shape makes the status of every task readable at a glance, which is what lets a team catch a problem while it is still cheap to fix.
Originating from the Toyota Production System, the term "Kanban" is Japanese for "signboard" or "billboard." It uses cards (often referred to as Kanban cards) and columns to represent tasks and their stages in a workflow. The primary purpose of a Kanban chart is to visualize the progress of tasks and ensure smooth flow without bottlenecks.
How Does Kanban Chart Work in Project Management?
In project management, the Kanban chart works as a real-time, visualized process that helps teams manage their workflow effectively. The steps below trace directly back to the core Kanban principles the method is built on. Here’s a step-by-step look at how a Kanban chart functions:
- Visualize Work: Each card carries the detail that keeps a board readable: task name, due date, description, assignee. One card is one snapshot of one piece of work, so the board shows what is happening without anyone writing it up separately.
- Limit Work in Progress (WIP): A WIP limit caps how many tasks may sit in "In Progress" at once. When the column is full, the team has to finish something before starting anything new, which is what cuts context switching. In Quire the count in each column header is what makes a breach visible.
- Manage Flow: Cards move from "To Do" to "In Progress" to "Done", and watching that movement is how a bottleneck surfaces. A cluster stalled in one stage points at capacity, not at effort. That is the cue to send help to that stage, or to lower the WIP limit feeding it.
- Make Process Policies Explicit: Clearly defined policies and criteria for moving tasks between stages help ensure that everyone understands the workflow process. This can include guidelines on task prioritization, criteria for moving tasks to the next stage, etc.
- Implement Feedback Loops: Regular reviews and feedback sessions (such as daily stand-ups or retrospective meetings) are conducted to discuss the progress, address any issues, and make necessary adjustments to improve the workflow.
- Improve Collaboratively: Using data and feedback, the team continuously improves the process by making incremental changes to enhance efficiency and productivity.
What Are the 5 Benefits of Using a Kanban Chart?
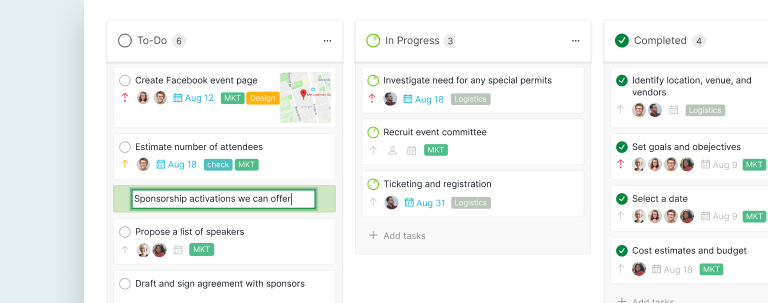
Implementing Kanban charts in project management offers several benefits:
Enhanced Visibility
Kanban boards give real-time visibility into your workflow. Each card moves from "To Do" to "In Progress" to "Done", so where a task stands is readable at any moment.
Think of a traffic map. The congested stretches, where cards crawl, are where the workflow is actually failing.
By readily identifying these bottlenecks, teams can take corrective actions quickly. For example, if several cards remain stuck in "In Progress" for extended periods, it might indicate workload overload or resource limitations. This immediate insight equips proactive adjustments, such as delegating tasks or adjusting WIP limits, to ensure a smooth and efficient flow of work.
Improved Efficiency
By limiting the number of tasks in progress and focusing on completing them before starting new ones, teams can avoid bottlenecks and ensure a smooth flow of work. This leads to higher productivity and faster delivery of projects.
Flexibility and Adaptability
Kanban boards thrive in dynamic environments. Unlike rigid project management methods, Kanban embraces change. New tasks can be readily added to the "To Do" column, accommodating evolving project requirements. Priorities can be easily adjusted by simply reordering cards within the board. This agility allows teams to react swiftly to unexpected roadblocks or emerging high-priority tasks.
Plus, Quire Kanban boards themselves are highly customizable. Teams can tailor the workflow stages (e.g., "Design Review" or "QA Testing") to perfectly suit their specific needs. This level of control equips teams to optimize their workflow for maximum efficiency, regardless of project type.
Better Collaboration
The visual nature of Kanban charts supports collaboration among team members. It provides a common platform where everyone can see the progress, discuss issues, and work together to achieve the project goals.
Continuous Improvement
The iterative nature of Kanban encourages continuous improvement. Regular feedback and review sessions help teams identify areas for improvement and make necessary adjustments to enhance their workflow and productivity.

What Are the 4 Types of Kanban Charts?
Kanban charts come in various types, each designed to cater to different needs and preferences. Here are four common types:
4 types of Kanban charts at a glance
| Type | Best for | Visual structure |
|---|---|---|
| Basic Kanban | Simple workflows, small teams | Single board with To Do / In Progress / Done columns |
| Swimlane Kanban | Complex projects with parallel tracks | Horizontal lanes per category, stage columns |
| Personal Kanban | Individual work management | Same columns, scoped to one person's tasks |
| Portfolio Kanban | Multiple concurrent projects | One board per project rolled up to portfolio view |
Basic Kanban Board
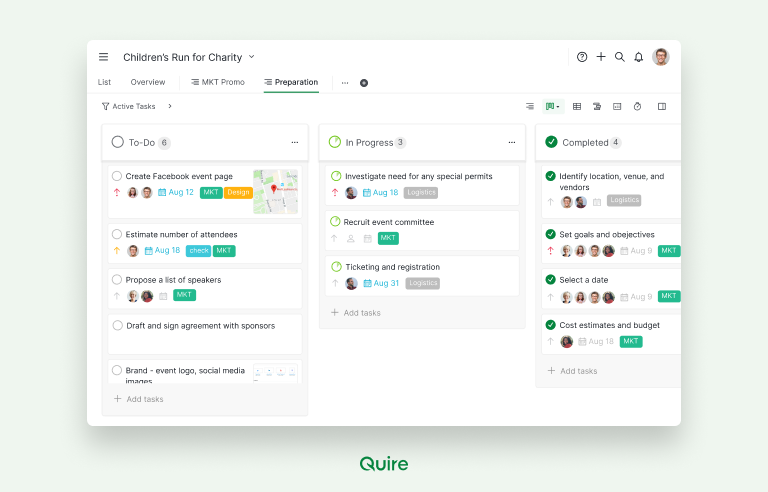
The cornerstone of Kanban methodology is the Kanban board itself. Its most fundamental form, the Basic Kanban Board, offers a straightforward yet powerful way to visualize and manage workflows. This board typically features three core columns, each representing a distinct stage in the task lifecycle:
- To Do: This is the starting point, a holding area for all upcoming tasks. It acts as a backlog, allowing teams to prioritize and plan their workload effectively.
- In Progress: Tasks migrate here once actively underway. This column provides a clear view of what's currently being worked on and by whom, so accountability is visible without a status meeting.
- Done: The final destination for completed tasks. Seeing tasks accumulate here offers a sense of accomplishment and motivates teams to keep the workflow moving forward.
The beauty of the Basic Kanban Board lies in its simplicity. Despite its minimal structure, it provides a powerful framework for teams to grasp their workflow at a glance, identify bottlenecks, and ultimately deliver projects more efficiently.
Swimlane Kanban Board
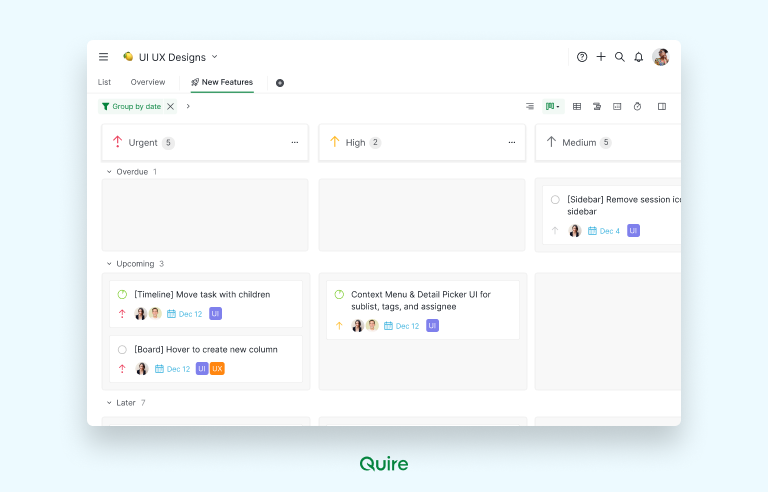
The Basic Kanban Board offers a solid foundation, but what if you need to manage even more complexity? Enter Swimlane Kanban. This powerful Kanban variant takes the core concept and introduces horizontal lanes, also known as swimlanes.
These swimlanes act like additional folders within your board, allowing you to categorize tasks based on various criteria. Imagine the basic Kanban board as a one-dimensional to-do list, while Swimlane Kanban is a multi-layered spreadsheet. Both are effective for organization, but Swimlane Kanban provides a more nuanced view.
By grouping tasks by, say, project phase (design, development, testing) or team members (marketing, engineering, sales), Swimlane Kanban gives you better organization, clearer ownership, and a workflow that is easier to manage.
Personal Kanban Board
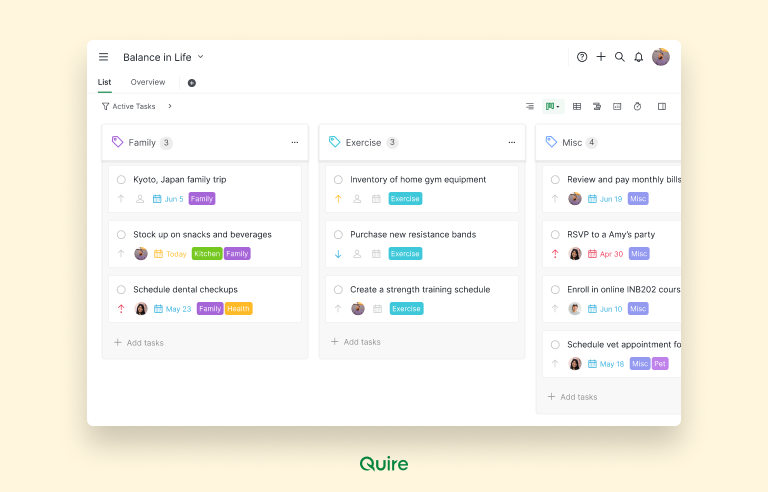
Personal Kanban applies the same method to your own work rather than a team's. It behaves like its project management counterpart, but the cards are personal tasks and goals. A project board is a roadmap; a Personal Kanban board is a life organizer.
Both use the core stages (To Do, In Progress, Done), but a Personal Kanban board often adds columns of its own: "Waiting For" for anything that depends on someone else, or "Someday/Maybe" for what you have not committed to yet.
The tasks differ too. They run from work errands to personal goals, like learning a language or finally clearing that closet.
By visualizing your workload and prioritizing tasks, Personal Kanban helps individuals achieve a sense of accomplishment, reduce stress, and ultimately, keep up with everything daily life keeps adding to the pile.
Portfolio Kanban Board
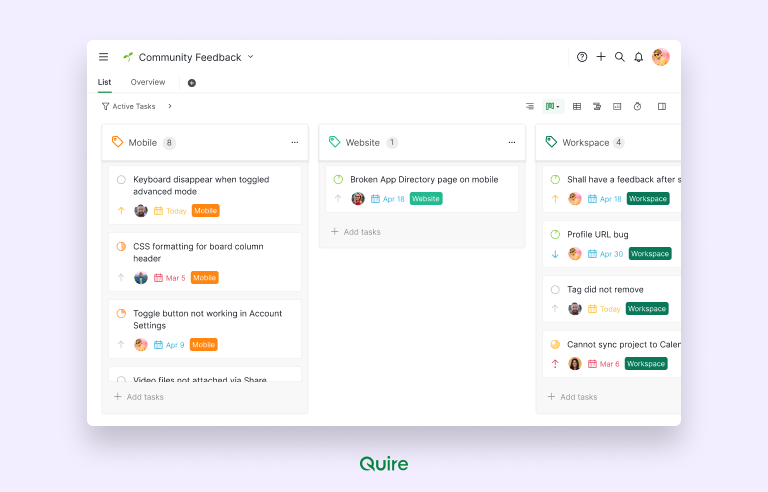
Portfolio Kanban boards act as a conductor's view for managing a mix of projects. Unlike a project Kanban board that focuses on a single project's details, the portfolio board takes a high-level approach. It visualizes large initiatives (epics) across different projects, typically using stages like "Concept," "In Development," and "Deployment." This allows teams to:
Portfolio Kanban boards prevent project silos. By visualizing all projects together, teams can identify dependencies between initiatives and proactively address potential roadblocks. With a clear view of workload across projects, portfolio boards equip strategic prioritization of epics. Teams can allocate resources effectively, ensuring the most important initiatives progress smoothly.
If the chart is decided and the tool is not, Best 15 Project Management Software with Kanban Board (2026) compares fifteen Kanban-board tools on what each is best for.
Charts measure the board after the fact. To read the board itself, see the four signals a working kanban board sends.
What's the Difference Between a Gantt Chart and a Kanban Chart?
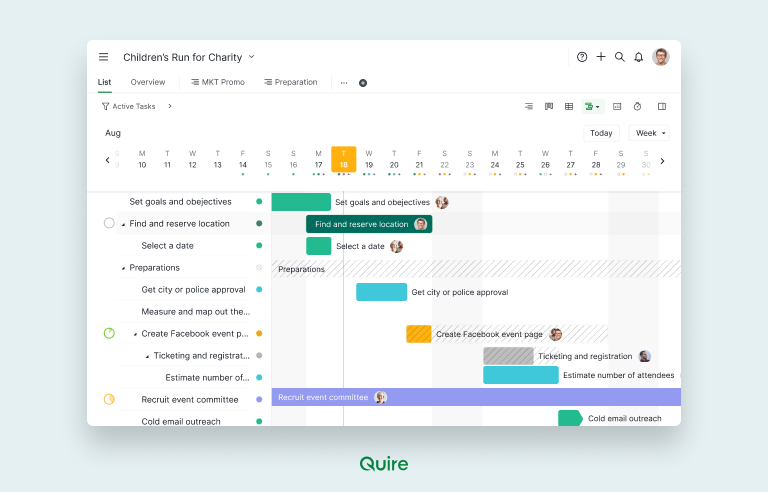
| Feature | Gantt Chart | Kanban Chart |
|---|---|---|
| Visual Representation | Timeline view with start/end dates and dependencies | Workflow stages and task progress |
| Flexibility | Less flexible, requires adjustments for changes | More flexible, tasks can be easily added/removed/reprioritized |
| Complexity | Better for complex projects with many tasks and dependencies | Better for simpler projects focusing on workflow and efficiency |
| Real-Time Updates | May not provide real-time visibility | Offers real-time updates on task status |
| Collaboration | Less effective for collaboration | Promotes better collaboration among team members |
Related: What Is a Scrum Master? Role, Responsibilities, and How Scrum Works (2026). Kanban and Scrum solve similar problems differently; this covers the role that runs a Scrum team day to day.
Create Your Kanban Chart in Quire
Switch to the Kanban view in Quire
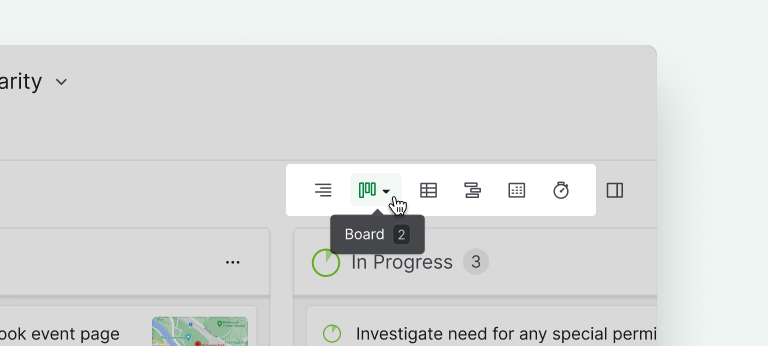
Create your tasks in Kanban view: You can select an existing task on a column and press “Enter” to create a new same-level task or “Shift + Enter” to create a subtask that links to the chosen existing parent task.
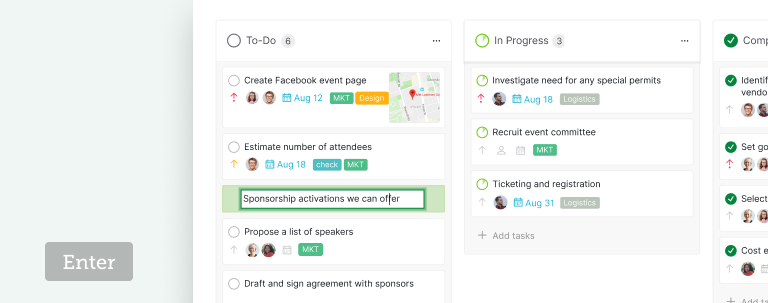
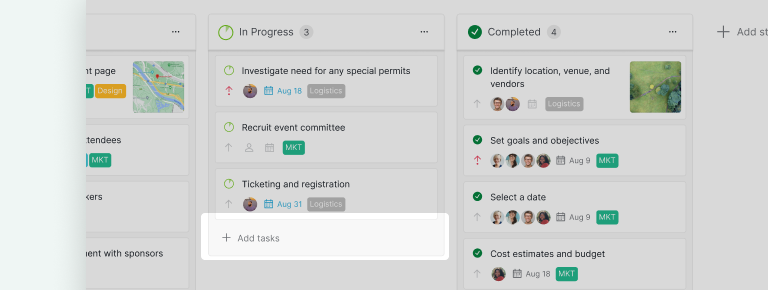
In the bottom corner of each column, click “Add tasks” then start typing in your task name and any parameters (e.g. Assignee, priority, etc.). Then press enter to save your new task.
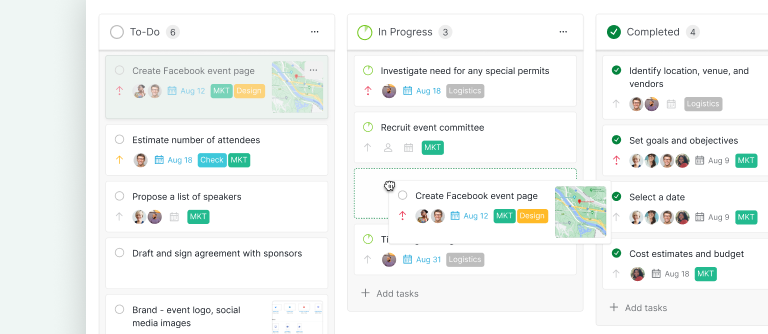
Go to your Kanban view and reposition your tasks in the columns.
Improve Your Project Management with Kanban Chart in Quire
Quire, a modern project management tool, offers powerful Kanban chart features to help teams cut the busywork from their workflow and improve productivity. Here’s how you can use Kanban charts in Quire to improve your project management:
- Create Custom Kanban Boards: Quire allows you to create custom Kanban boards tailored to your project’s specific needs. You can add columns, set WIP limits, and customize the workflow to suit your team’s requirements.
- Visualize and Track Progress: Progress reads off the board itself rather than a separate report. Drag a card to move it across stages and the status updates in real time, and subtask progress rolls up onto the parent card so you can see a branch's state without opening it.
- Collaborate Effectively: Quire’s Kanban boards provide a collaborative platform where team members can discuss tasks, share updates, and work together smoothly. The commenting and tagging features facilitate effective communication and collaboration.
- Integrate with Other Tools: Quire integrates with various tools and platforms, allowing you to synchronize your Kanban boards with other project management and productivity tools. This ensures a smooth flow of information and enhances overall efficiency.
- Monitor and Improve: Quire provides analytics and reporting features that help you monitor the performance of your Kanban boards. You can track key Kanban metrics, identify bottlenecks, and make data-driven decisions to improve your workflow continuously.

A Kanban chart changes how you see a project, not just how you record it. Pick the chart type that answers the question you actually have, and it will show you where work is stuck and how fast the rest clears. Quire draws its charts from the board your team already uses.
For the level above the chart, where the timeline, calendar and table also get a hearing, see which project view fits the shape of the work.
Frequently Asked Questions
What is a Kanban chart?
A Kanban chart is a visual project management tool that tracks work across columns like To Do, In Progress, and Done. Cards move across columns as tasks progress.
How does a Kanban chart work in project management?
Teams visualize work on cards, cap tasks in progress, and watch the board to spot bottlenecks. Regular feedback and WIP limits keep the flow healthy.
The chart is only as honest as the board underneath it. Quire draws its charts from the same tasks the team already moves, so the numbers update as the work does.
What are the main types of Kanban charts?
The four most common are basic, swimlane, personal, and portfolio Kanban boards. Each type fits a different scale of workflow complexity.
What are the key benefits of using a Kanban chart?
Kanban charts deliver better visibility, efficiency, flexibility, collaboration, and continuous improvement. The visual format replaces a lot of status updates.
What's the difference between a Gantt chart and a Kanban chart?
Gantt charts emphasize timelines and dependencies; Kanban charts emphasize workflow stages and real-time status. Kanban is more flexible, Gantt is stronger for complex schedules.
They answer different questions rather than competing, and the choice is not permanent. In Quire the board and the Timeline read the same tasks, so you can watch flow on one and sequence on the other without keeping two plans.