features · Oct 13, 2025
Introducing Power BI Integration with Quire

Last updated: July 3, 2026
The Quire + Power BI integration connects Quire as a live data source to Power BI Desktop through a Custom Connector (the QuirePowerBI_BETA.mez file). Project and task data loads as structured tables, so you can build dashboards for status, workload, planned-vs-actual, and multi-project portfolios. Setup in four moves: request the .mez from info@quire.io, allow third-party connectors in Power BI Options → Security, drop the file into Documents\Power BI Desktop\Custom Connectors, restart, then connect via Get Data → Quire (Beta). Available on the Enterprise plan only.
A Quire project shows what got done. It does not show, on its own, how a team is trending across multiple projects, where workload is unbalanced, or whether estimates are drifting from actuals. Those answers live in cross-source analysis, and that analysis needs a BI tool.
The Quire and Power BI integration connects the two directly. Project and task data loads into Power BI Desktop as structured tables, so you can build dashboards with the full Power BI feature set and join Quire data with any other source in the same report.
Power BI's position in the BI market is well-established. Gartner consistently places Microsoft as a Leader in its annual Magic Quadrant for Analytics and Business Intelligence Platforms, and Forrester ranks the platform similarly across its Wave evaluations of augmented analytics and BI platforms. The Quire connector follows the same Custom Connector pattern Microsoft documents for third-party data sources: a signed .mez file, OAuth-based authentication, and structured table output that any DAX measure or visual can consume.
Power BI integration is made for Enterprise subscription plan exclusively. More information can be found on our Pricing page.
Quire reporting workflow: before and after Power BI
Why Does the Quire and Power BI Integration Matter?
Power BI extracts patterns that raw task lists hide. Once Quire data is loaded as tables, you can build the kind of reports that previously required engineering work on top of spreadsheet exports.
Two examples cover most use cases:
- A project manager rolling Quire data into the company's existing BI reports. The connector loads Quire as a data source, so project progress sits alongside revenue, support, or operational data in the same dashboard.
- A team lead reporting across multiple projects. Tables can be filtered, grouped, and joined to track workload distribution, planned-versus-actual performance, and trend lines across the portfolio.
How to Integrate Your Quire Projects with Power BI
Connecting Quire with Power BI is simple and only takes a few steps. Once set up, your project data in Quire will automatically flow into Power BI, letting you explore progress, performance, and trends through dynamic visuals and reports. Before getting started, make sure you have the necessary setup ready.
I. Prerequisites
- Power BI desktop.
- Quire connector beta file: please email info@quire.io to get the beta file.
II. Configuring Power BI to accept 3rd party connectors
- Open Power BI Desktop
Access
"File” > “Options and settings” > “Options” > “Security"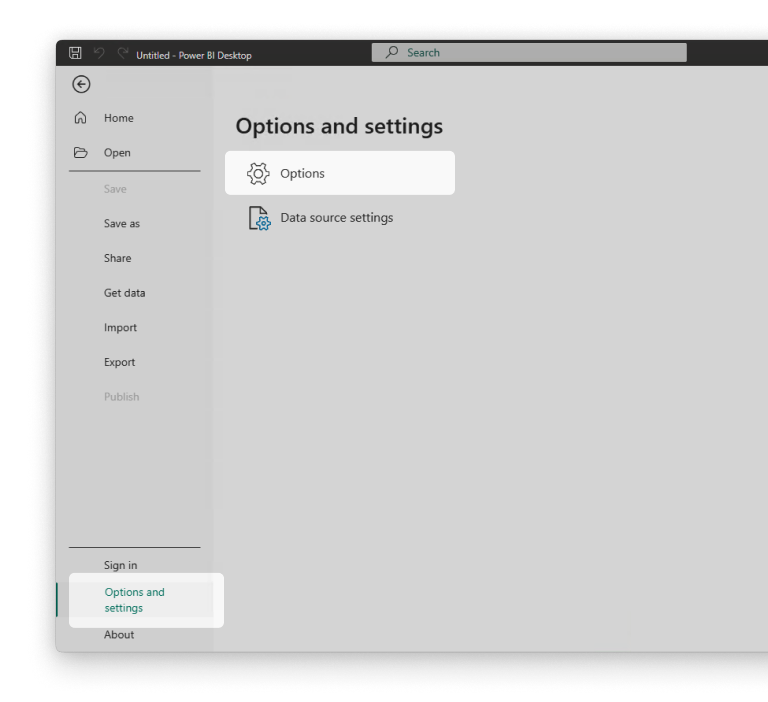
Set Data Extensions to
“(Not recommended) Allow any extension to load without validation or warning”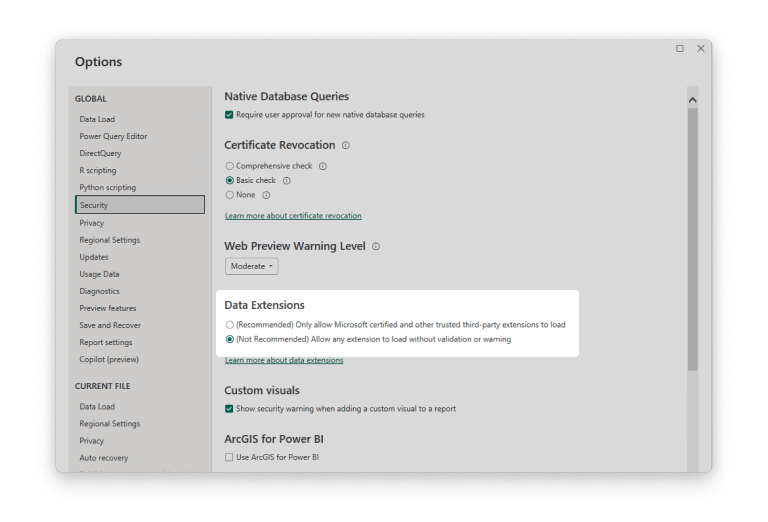
III. Installing Quire connector beta file
- Navigate to your documents folder
- Create the
Power BI Desktop\Custom Connectorsdirectory (if not present) - Paste the QuirePowerBI_BETA.mez into “Custom Connectors”
- File location should be
C:\Users\YourName\Documents\Power BI Desktop\Custom Connectors\QuirePowerBI_BETA.mezon a standard Windows installation. If your documents folder is located in a different location, modify accordingly. - Restart Power BI Desktop.
IV. Using the connector to retrieve data
Navigate to
“Home” > “Get Data” > “More…”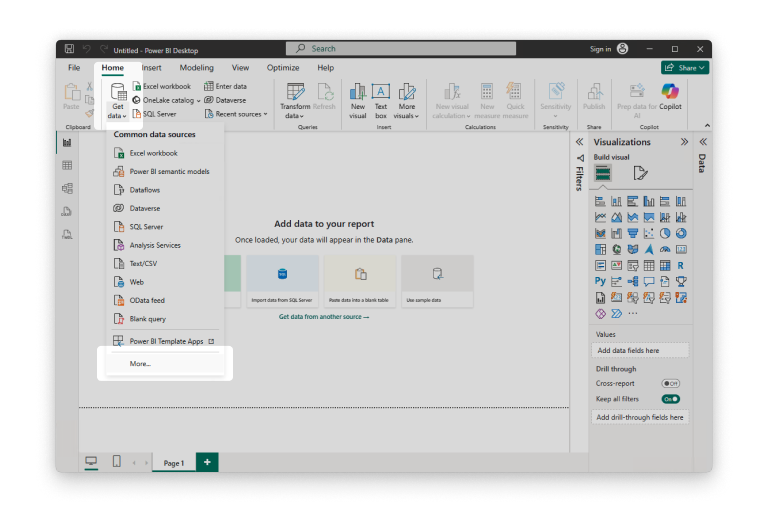
Navigate to
“Other” > “Quire (Beta) (Custom)”, or search “Quire” in the search field.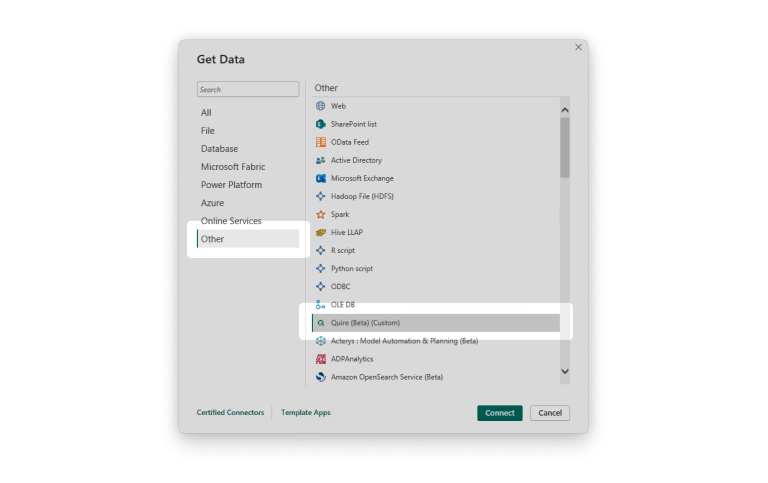
Choose “Connect”
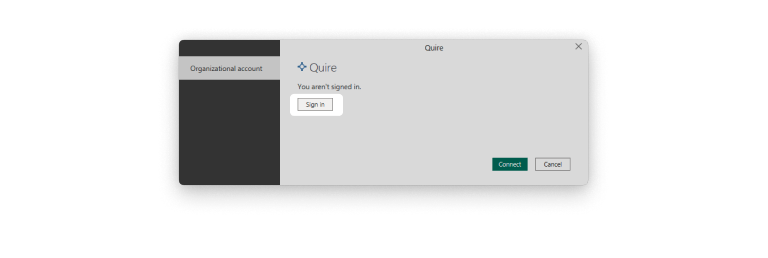
If you have not yet connected Power BI or if your token is expired, you will be prompted to connect.
Choose Sign-in, or Sign-in as a different user.
The Quire API authorization page will be displayed.
Choose “Specific organization or project” to select the organization which you want to authorize data retrieval from, or “All organizations and projects” to authorize all data which you have access to.
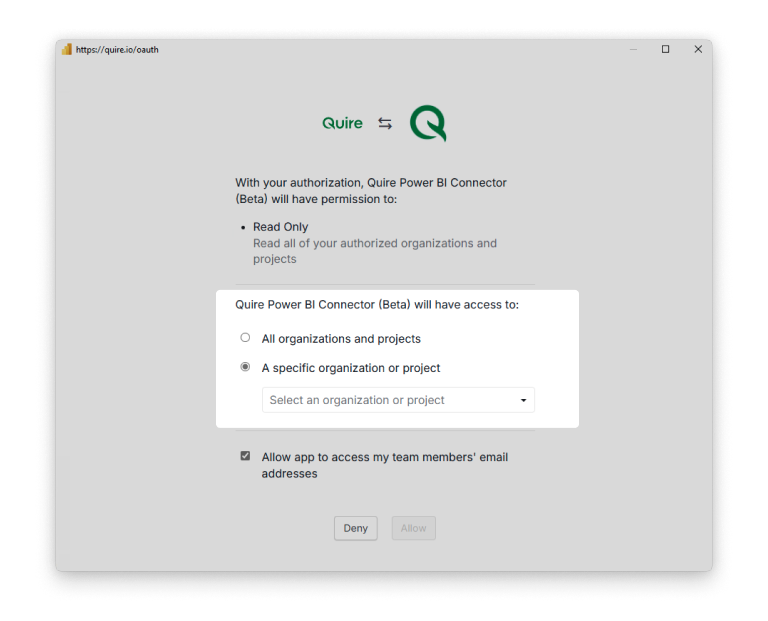
Click “Allow” to grant Power BI access to your organization.
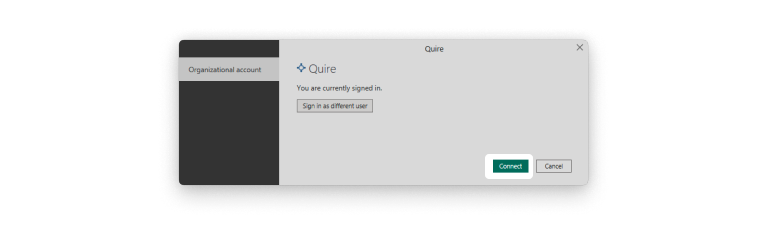
Choose “Connect” to start data retrieval.
Select the project you want to analyze, then choose the data tables relevant to your report. The Raw Data table is generally not required, as it’s less convenient for creating relationships. Regular tables are easier to connect and organize when building your reports.
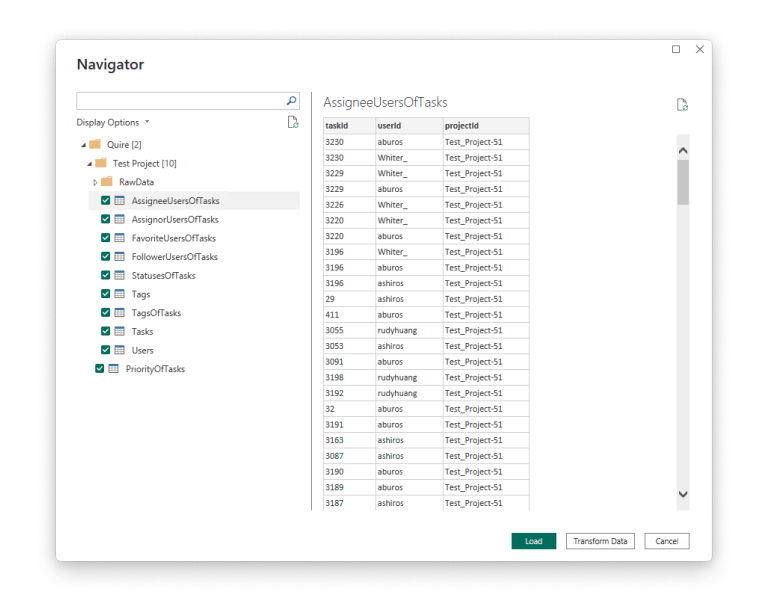
Click “Load” to start retrieving data.
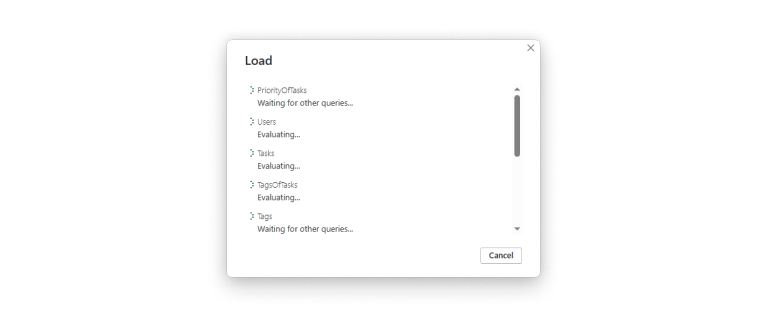
How to Build a Dashboard from Your Quire Data
Once your data is ready, you can start creating a dashboard in Power BI. The data is organized into separate tables for easier use. Simply select the tables you want to work with by checking the boxes, then click Load.
If needed, you can transform or clean the data before building your visuals to make it more tailored to your reporting needs.
After loading, your Quire task data will sync with Power BI. Depending on the size of your team or project portfolio, this process may take anywhere from a few seconds to several minutes.
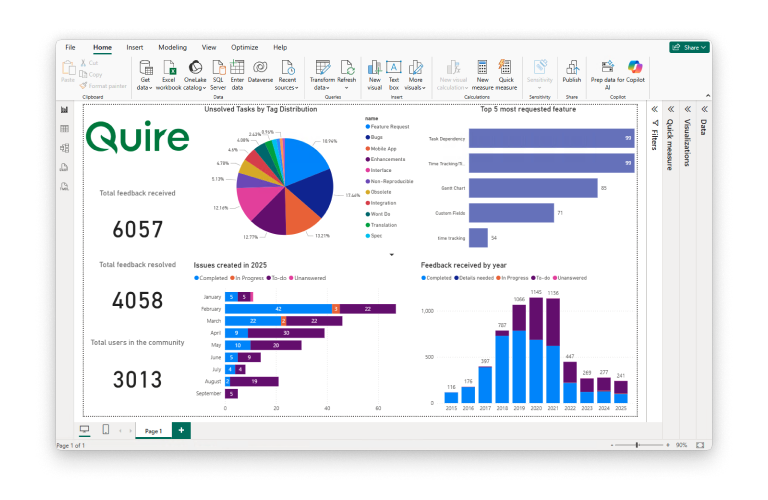
Once the data appears in Power BI, you can begin building your dashboard. Use the fields on the right-hand panel to drag and drop data into charts, tables, and other visuals to create an interactive, insightful view of your projects.
What's the Next Step?
If your team already runs Power BI for other reports, request the QuirePowerBI_BETA.mez connector at info@quire.io, drop it into Documents\Power BI Desktop\Custom Connectors, restart Power BI Desktop, and load your first project. The four-step setup takes minutes once you have the file.
The integration is exclusive to the Enterprise plan. See the pricing page for full details, or contact info@quire.io to discuss whether an Enterprise upgrade fits your reporting needs.
Frequently Asked Questions
What does the Quire and Power BI integration do?
It connects Quire as a data source to Power BI so project and task data flows in as structured tables, ready to visualize in interactive dashboards.
What do I need before connecting Quire with Power BI?
Power BI Desktop, the Quire connector beta file (request it at info@quire.io), and Power BI configured to allow third-party connectors.
How do I install the Quire connector for Power BI?
Drop the .mez file into Documents\Power BI Desktop\Custom Connectors, restart Power BI Desktop, then connect via Get Data → Quire (Beta).
What kind of dashboards can I build from Quire data?
Project status, workload distribution, planned-vs-actual performance, and multi-project portfolio views. Anything you can build in Power BI with table data is available.
Is the Power BI integration available on all Quire subscription plans?
No. It's exclusive to the Enterprise plan. Full details on the pricing page.