workstyle · Oct 9, 2025
Project Management KPIs: How to Define, Set Up, and Track Them

Last updated: July 12, 2026
A KPI is a measurable value that shows whether you're moving toward a specific objective. Every KPI is a metric, but not every metric is a KPI; the test is whether tracking it would actually change a decision. Most teams track too many. Aim for three to five per team or project, covering outcome, quality, and timing. In Quire, KPIs work best as a custom-field formula that scores each task on completion and timing so the indicator updates with the work itself instead of in a separate dashboard.
Most project KPI dashboards die quietly after the first quarter. Someone builds a 30-row spreadsheet in week one, the team admires it, and by month three nobody opens it. The tool isn't the problem. The problem is that "KPI" got stretched to mean "any number we can measure," when the version that actually works is narrower: the handful of metrics that, if they moved, would change what your team does next sprint.
For a project manager, that line is the whole job. You don't need your team's average task touch-count. You need to know whether work is shipping on time, whether the budget is holding, and where things keep getting stuck.
This post is about the project management KPIs worth tracking, how they're different from the vanity metrics that just pad a dashboard, how many to run (fewer than you'd think), and how to set them up in Quire so the number updates as the work moves instead of when someone remembers to refresh a slide. The need only sharpens as you scale: KPIs are how growing teams keep shared visibility once no one can eyeball every task by hand.
What Are KPIs?
KPIs (Key Performance Indicators) are measurable values that show how effectively an individual, team, or organization is achieving its objectives. A KPI turns a goal into a number you can check, so progress stops being a feeling and starts being a fact.
For example:
- In project management, a KPI could be the percentage of tasks completed on time.
- In sales, a KPI could be the number of new clients closed each quarter.
- In marketing, a KPI could be the conversion rate from campaigns.
Put simply, a KPI tells you “where you are” versus “where you want to be.”
Which Project Management KPIs Should You Actually Track?
Projects fail in a few predictable places. The schedule slips, the budget creeps, quality quietly drops, or the team burns out holding it all together. Good project management KPIs are early-warning lights for exactly those failure points. Here are the ones that earn their place, grouped by what they protect.
You won't track all of these, and you shouldn't try. Pick the two or three that map to how your projects actually fail, and let the rest go. (Yes, let them go. A dashboard with five honest numbers beats one with forty decorative ones.)
What Is a Performance KPI in Workload Management?
In workload management, performance KPIs measure how well tasks get finished, not just whether they get finished. Raw volume (how many tasks are done) misses the point; what you actually care about is quality, efficiency, and timeliness.
Some examples of performance KPIs in workload management include:
- Task Completion Rate: The percentage of assigned tasks finished within a given timeframe.
- On-Time Delivery Rate: The ratio of tasks completed before or on the deadline.
- Overdue Tasks: The number of tasks not completed by their due dates.
- Workload Balance: The distribution of tasks among team members.
Why does this matter? Because in real projects, it’s not enough to just get things done, you need to get them done on time and to the right standard. That’s exactly what tracking KPIs in workload management tells you.
Why Are Key Performance Indicators Important?
If most KPI dashboards die quietly, why keep building them? Because when the numbers are the right ones, five things change:
1. How Do KPIs Provide Clarity and Focus?
Every project generates noise: pings, side requests, and tasks that feel urgent mostly because someone typed them in all caps. A well-chosen KPI works as a filter. It tells the team not just what to do but why it matters this sprint.
It also keeps marketing, operations, product, and leadership arguing about the same number instead of four different ones. Working hard on the wrong things is the most expensive habit a team can have, and it never shows up on a timesheet.
2. How Do KPIs Drive Accountability?
Without KPIs, accountability turns into opinion, and opinion turns into office politics faster than anyone would like. A number takes the personal sting out of the conversation. You’re not saying “you’re slow,” you’re asking “cycle time doubled this month, what changed?”
That’s a fairer deal for everyone. People get measured against the same visible yardstick, not against who presents best in the Monday meeting.
3. How Do KPIs Power Continuous Improvement?
A single KPI reading is a snapshot; the trend is the story. Track one for a few sprints and the patterns surface: the review stage that always jams, the teammate quietly carrying a double load, the delay that shows up every quarter like clockwork.
That’s the shift from asking “Why are we behind schedule again?” to saying “Let’s rebalance tasks earlier next sprint.” Same data, but now you get to use it before the fire instead of after.
4. How Do KPIs Build Motivation?
Invisible progress is demoralizing. You can grind for three weeks and have nothing to show for it except a slightly shorter task list, which nobody frames and hangs on the wall.
A climbing chart fixes that. Watch your on-time completion rate go from 60% to 85% and the whole team feels it; the number becomes something worth defending. KPIs are as much about celebrating wins as they are about spotting gaps.
5. How Do KPIs Sharpen Decision-Making?
Gut feeling is a fine tiebreaker and a terrible primary source. KPIs give you receipts. If tasks keep slipping because two people are doing the work of four, the overdue count makes the case for hiring better than any impassioned Slack message ever will.
And it cuts both ways. If the team keeps beating its targets, the same numbers give a manager cover to aim higher.
Without KPIs, you’re driving with the dashboard covered. The engine might be fine. You just won’t know until something starts smoking.

How Do You Set Up KPI Tracking in Quire?
Enough theory. In Quire, a collaborative project management platform, a KPI can live inside the project itself and update as the work moves; no spreadsheet, no relying on someone’s Friday-afternoon diligence to refresh it.
Here’s how to set up performance KPI tracking in Quire, step by step:
Step 1: Create a Custom Field for KPI Calculation
For tracking task performance, create a column in the custom field, name it KPI Point, apply the following formula, and choose the format as Number.
COUNT(assignees) * ((due = null) ?? false ? null: status < 100 ? (due < <today>) ? -2: 0: (completedAt < due) ? 1: -1)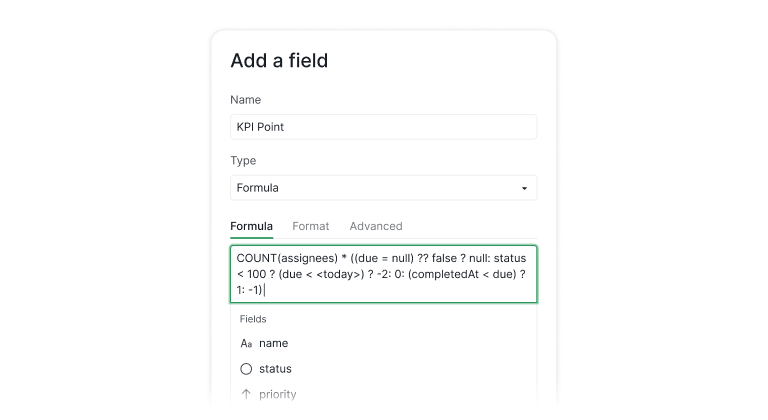
Here’s what this formula does:
- 1 point → if the task is completed before the due date.
- - 1 point → if the task is completed after the due date.
- - 2 points → if the task is overdue and not completed.
- 0 points → if the task is not executed yet but still within the due time.
This system creates a performance scoring model for every task assigned.
Step 2: Apply KPI Tracking Across Tasks
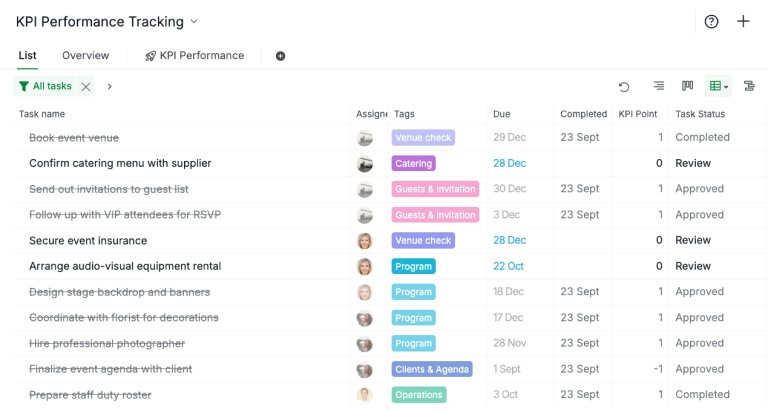
Once the field is created, every task in your project with a due date picks up a KPI Point on its own. Each task now carries a performance score based on completion status and timing, no manual scoring needed.
This gives you a quick way to assess:
- Which team members consistently complete tasks on time.
- Which projects are running into delays.
- Where overdue tasks are piling up.
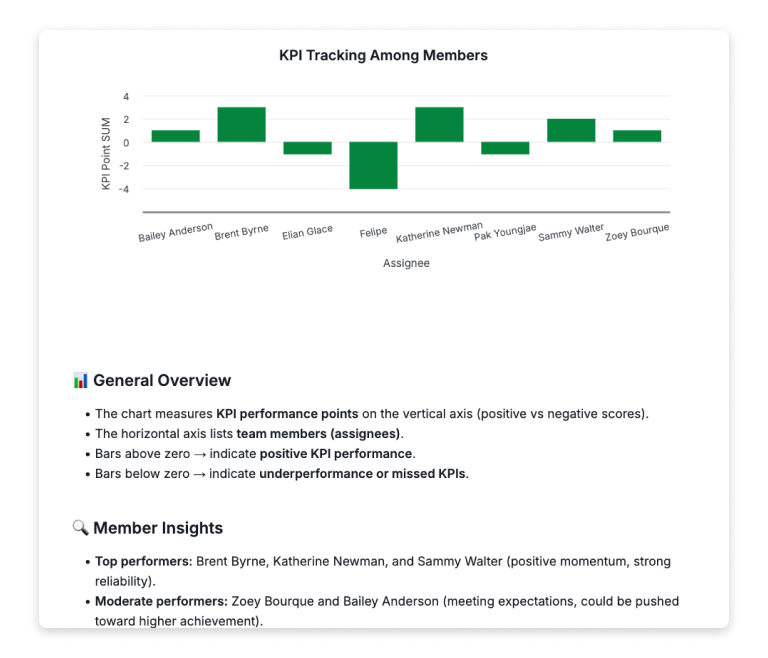
Step 3: Visualize KPI Data With Charts
Numbers are useful, but visuals make KPIs actionable. In Quire, you can generate charts to visualize KPI trends over time.
For example:
- Pie Chart → Visualize the task count breakdown by task categories.
- Stacked Bar Chart → Visualize the work progress status
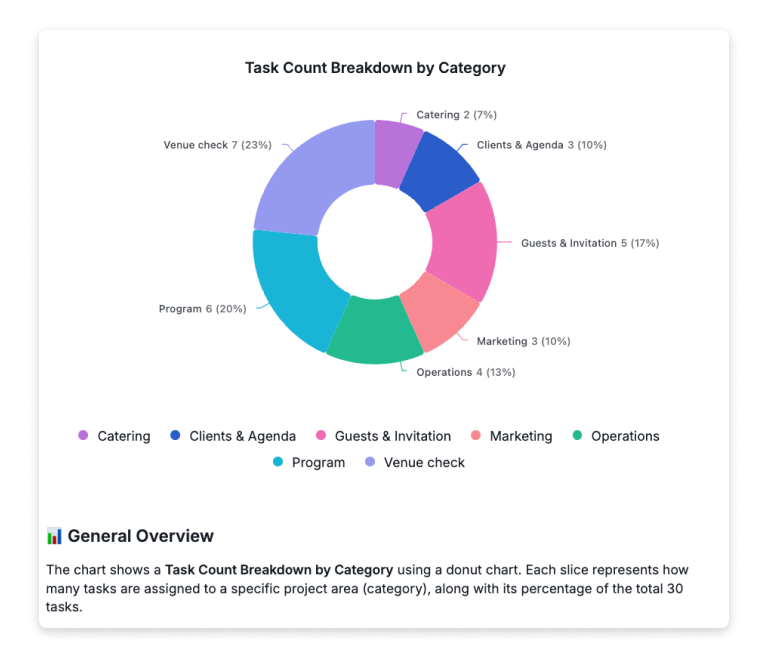
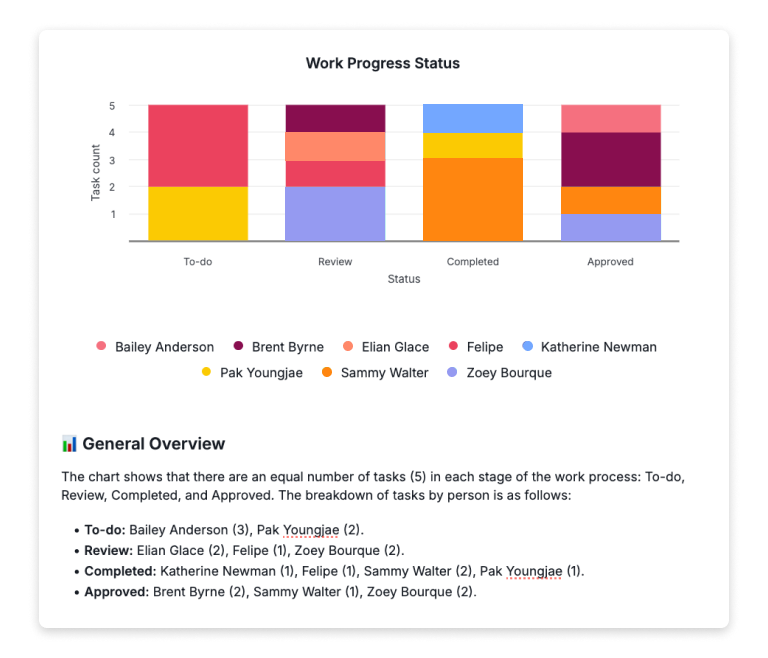
This makes it easy for managers to identify patterns. For instance, if a team’s KPI scores are consistently low in the last two weeks, it may signal workload imbalance or resource issues.
Step 4: Review and Adjust
KPI tracking isn’t “set and forget.” Use Quire’s reporting and charting features to review progress regularly. If the formula or scoring doesn’t reflect reality, adjust it.
For example, you could assign different weights to tasks based on priority or complexity.
If you’d like to access the KPI Tracking Template, please visit our template site.
What's the Bottom Line on Tracking KPIs?
A KPI is only worth tracking if it would change what your team does next. Pick the three to five numbers that map to how your projects actually fail, and ignore the rest with a clear conscience.
Then make tracking cheap. One custom field, one formula, a chart or two, and the score updates itself while your team works. No quarterly spreadsheet resurrection required.
Ready to try it? Define the KPIs that matter to your team, set up the formula above in Quire, and let the numbers do the arguing for you.

Frequently Asked Questions
What is a KPI?
A measurable value that shows how effectively a person, team, or organization is progressing toward a specific objective, turning goals into trackable numbers instead of subjective judgments.
What are the most important project management KPIs?
Track five fronts: schedule (on-time completion, schedule variance), budget (cost performance index), throughput (cycle time), quality (rework rate), and team health (workload balance, overdue tasks). Pick three to five, not all of them.
What's the difference between a KPI and a general metric?
Every KPI is a metric, but not every metric is a KPI. The test: if tracking the number wouldn’t change a decision, it’s a metric, not a KPI.
What is a performance KPI in workload management?
A measure of how effectively tasks get completed, covering quality, efficiency, and timeliness. Examples: task completion rate, on-time delivery rate, overdue task count, and workload balance.
How many KPIs should a team track?
Aim for three to five per team or project, enough to cover outcome, quality, and timing without diluting focus. If everything is a KPI, nothing is.
How do you track KPIs in Quire?
Create a custom field with a scoring formula, apply it across your project so every task carries a performance score, then use charts to visualize trends and spot bottlenecks.
