project management · Oct 13, 2026
Project Budget Tracking: 4 Numbers Per Line and a Template

Last updated: October 13, 2026
Project budget tracking means comparing the planned amount on every spend line with the actual spend, often enough that an overrun is still cheap to fix. Most budgets drift for a dull reason: costs get logged late, in a file nobody opens, away from the work they paid for. This guide gives you the four numbers per line, the baseline with a contingency row, a weekly review sorted by variance, and the whole thing run in Quire with the Budget Allocation template, where the budget sits on the tasks instead of beside them.
- What is project budget tracking?
- Why does a project budget drift?
- How do you build the baseline before anything is spent?
- Which four numbers do you track on every line?
- What comes with the Quire Budget Allocation template?
- Spreadsheet or task management software: where does the budget stop being true?
- What does project budget tracking look like in practice?
- What do you change when you copy the template?
- How often should you review a project budget?
- Key takeaways
- Frequently asked questions
The finance sheet says the launch campaign has $4,200 left. The project lead's own sheet says $1,900. The agency invoice that explains the gap is in someone's inbox, and that someone is on vacation until the 24th.
If that scene feels familiar, you're keeping a shadow spreadsheet. I've kept one too. It starts as a quick personal copy of the real budget, just so you can see your lines. Within a month it's the only version anyone trusts.
It's also the only version nobody else can see.
Project budget tracking doesn't need a second file. It needs four numbers per line, a place to keep them that the team already opens every day, and a ten-minute weekly habit. This post covers all three, then runs the whole thing in Quire.
What is project budget tracking?
Project budget tracking is the routine comparison of what each spend line was allocated with what it has actually cost, done often enough that you can still change the outcome.
The word doing the work in that sentence is line. A single total tells you that you're over.
Lines tell you where, and where is the only thing you can act on.
Project budget tracking: recording the planned amount, the actual spend and the variance for every spend line of a project, and reviewing the variances on a fixed rhythm so an overrun is caught while the remaining budget can still absorb it.
The habit matters because of how overruns behave. Bent Flyvbjerg and Alexander Budzier at Oxford's Saïd Business School studied 1,471 IT projects and compared each budget with what the project actually cost. They expected the overruns to cluster around a modest average.
What they found, writing in the Harvard Business Review, was that one in six projects was a black swan. Those projects ran 200 percent over budget on average, with a schedule overrun of almost 70 percent.
Black swans don't announce themselves.
They look like a line that's 8 percent over in March, and nobody looks again until June.
Why does a project budget drift?
Because the spend is logged somewhere other than where the work happens, and later than when it happened. Neither is a character flaw.
The person who approved the extra agency day is in the project tool, the invoice is in email, and the budget is in a spreadsheet, so the three only meet when someone forces them to.
Three habits cause most of the drift.
Logging late. A cost recorded three weeks after it landed is a memory test, and memory rounds down. By the time it's entered, the variance it would have flagged has already been spent twice more.
Logging away from the work. When the budget lives in a separate file, updating it is a chore that interrupts the real job. Chores get batched, and batched costs are late costs (see above).
Totals typed by hand. Someone types a category total, the lines underneath change, the total doesn't. The sheet now disagrees with itself, and the only person who knows which number to believe is the one who typed it.
Here are the same three habits side by side, in a shared spreadsheet and in Quire.
| Where it goes wrong | In a shared spreadsheet | In Quire |
|---|---|---|
| Logging an actual | Open the file, find the row, recall the number | Type it in the Actual field on the task, invoice attached |
| The variance | A formula anyone can paste a value over | A formula field that only the formula writes |
| Category totals | Typed by hand, drifting from the rows beneath | Summed in the Table view footer |
| Who owns the number | Whoever edited last | The task's assignee |
| The weekly review | Reconcile the copies, then read | Sort by variance, read the top three rows |
A budget is the money half of a plan, and plans drift for the same reasons: the project plan template that holds past week two covers the other half.
How do you build the baseline before anything is spent?
Before the first dollar leaves, write down every line it could leave through, with a number and an owner on each. This is the baseline, and every later number in this post is measured against it.
Skip it and all you can do later is narrate the overrun.
List the lines, not the departments
A line is a thing you can buy or a person-month you can book. "Marketing" is a department. "Paid social, launch month" is a line. Lines sit under categories, and the categories are whatever your finance team already uses, so the project budget and the company budget speak the same language.
Put a number and a name on each
Every line gets a planned amount and an owner. The owner is the person who will know the real number without asking anyone, which is usually the person spending it. That one decision is what makes the weekly review ten minutes instead of forty.
Hold a contingency line
Add a row called Contingency with its own number, visible to everyone. Start around ten percent of the total and let your own history adjust it after a quarter. A reserve that exists only in your head gets spent without anyone noticing, including you.
Baselines belong to the planning phase, and what happens to them later is the rest of the story: the project life cycle, phase by phase shows where budget decisions land in each one.
Which four numbers do you track on every line?
Planned, actual, the variance between them, and forecast, the one that saves you. Here is what each one is, where it comes from, and what it tells you.
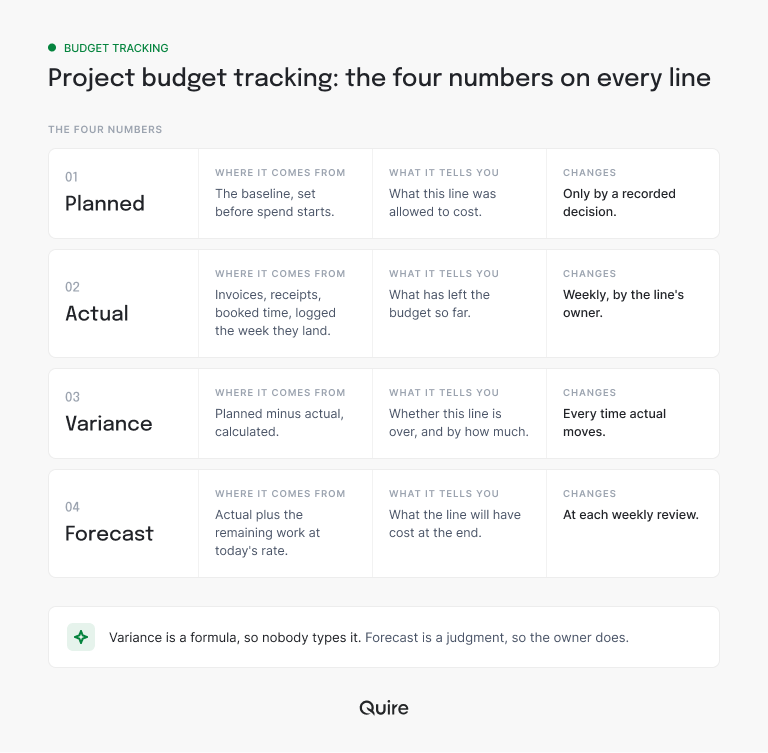
Variance is a formula, so nobody should ever type it.
Forecast is a judgment, so the owner types it, with a date.
One thing the chart hides. A line that's 10 percent under isn't good news by default. It might be savings, or it might be work that hasn't been invoiced yet. Only the owner knows which.
What comes with the Quire Budget Allocation template?
A quarterly budget laid out as a project. Planned and actual columns sit on every line, and a variance field turns red on its own the moment actual passes planned.
The sample is a marketing budget. The shape fits any project whose money leaves through named lines.
Open the Budget Allocation template and the sections are the spend categories: Brand & PR, Digital, Verticals, Sales Support, Marketing Tools, Others. The tasks under each section are the lines. Brand, PR, Events, Merch and Content sit under Brand & PR; Digital Media/Advertising, Channel Strategy and SEO sit under Digital.
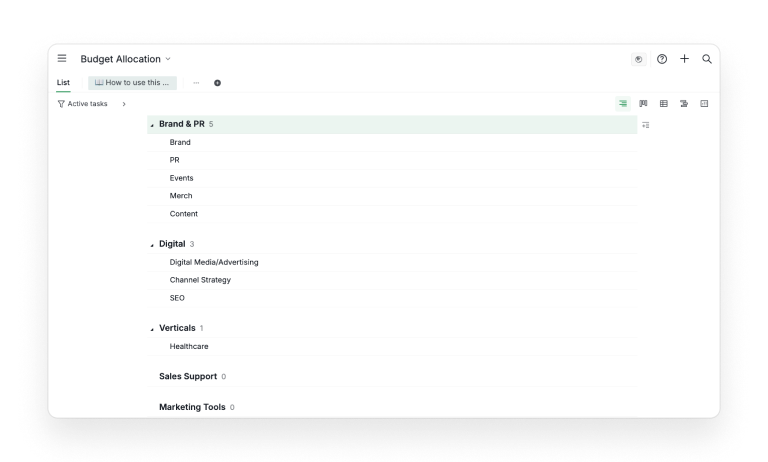
Each line carries four currency Custom Fields: Budget Q3, Actual Q3, Budget Q4, Actual Q4. Two more fields, Variance Q3 and Variance Q4, are formulas. Green while actual stays under budget, red the moment it doesn't.
Nobody types a variance.
Switch to Table view and the six money columns sit side by side, which is the only way a budget should ever be read. The footer sums each column. Sort by Variance Q3 and the overruns float to the top, which is your weekly review in one click.
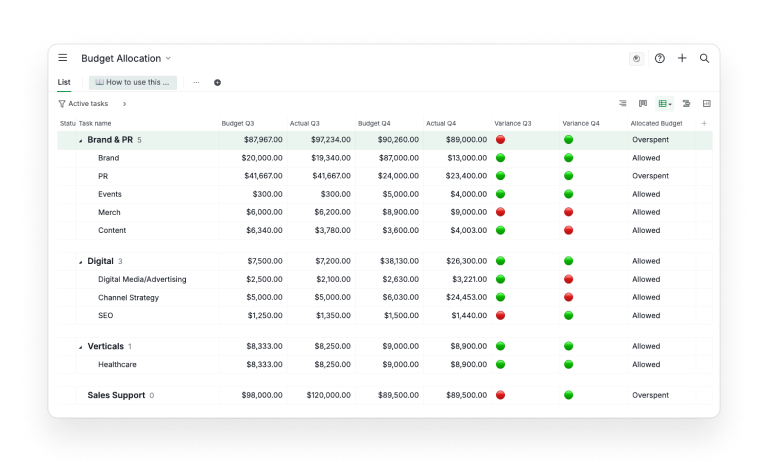
Try it before you take my word for it. Open a free Quire account, duplicate the template, and type one real actual over a sample number. The variance dot has answered before you've found your calculator.
To make it yours, duplicate the project. The dropdown beside its name holds Duplicate, and it asks which organization the copy lands in. Rename the sections to your categories and fill in the Budget fields at the start of the quarter. Delete the sample Allocated Budget field, which carries a threshold from the sample data.
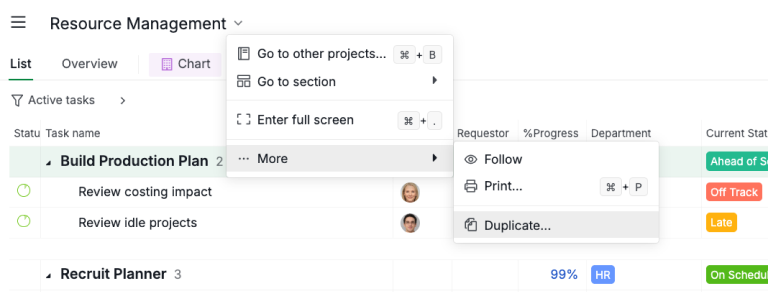
From then on, only the Actual fields need a human.
The formula behind that red dot is the same one you'd write for schedule variance or hours against a rate: Custom Fields and formulas, explained walks through building your own.
Spreadsheet or task management software: where does the budget stop being true?
A budget stays true in whichever tool the people spending it already open every day. For most teams that's the place the tasks live, which is why a budget in task management software drifts less than the same budget in a sheet.
The number sits on the task it belongs to, and the owner updates it without switching tabs.
A spreadsheet is a fine place for a budget until two things happen. Someone keeps a personal copy (hello again), and a category total gets typed instead of calculated. From then on, the sheet is a record of what people remembered, not what they spent.
In Quire, the spend line and the work it pays for are the same task. The person who approved the extra agency day updates its Actual field in the task where they approved it, with the invoice attached.
There's nothing to reconcile, because there was only ever one number.
If your team is still choosing where its work should live, the task management software guide compares the options on the things that matter past month one.
What does project budget tracking look like in practice?
Take a product launch campaign with a $38,500 budget across six lines. The campaign owner duplicates the Budget Allocation template, renames the sections to Launch Event, Paid Media, and Production, and enters the planned amounts.
Every line is a task with an assignee, the person who will know its real number. The review itself is one more task, assigned to the campaign owner, set to repeat every Friday so it never depends on anyone remembering.
| Line | Planned | Actual at week 6 | Variance |
|---|---|---|---|
| Venue and catering | $9,000 | $8,740 | Under |
| Paid social, launch month | $6,000 | $7,150 | Over by $1,150 |
| Agency video | $12,500 | $12,500 | On plan |
| Press kit and print | $2,800 | $1,100 | Under, not yet invoiced |
| Tooling and licenses | $4,200 | $4,200 | On plan |
| Contingency | $4,000 | $0 | Untouched |
At the week 6 review, the owner sorts the Table view by Variance. Paid social is red at the top. She opens the task and reads the comment thread where the extra audience test was approved. Then she makes the call.
Pull $1,150 from Contingency and note it on the Contingency task with the date and the reason. Tighten the week 7 spend cap on Paid social.
Eight minutes.
The campaign is still inside $38,500, the reserve shows $2,850, and the next review starts from that comment instead of from a question.
Press kit and print is the sneaky row.
It reads as under, but the owner knows the printer invoices on delivery. So the forecast stays at $2,800 and the "savings" never get spent twice.
When the campaign report is due, the same table feeds it: the status report template your stakeholders will actually read pulls numbers from live data instead of a Sunday-night rewrite.
What do you change when you copy the template?
The quarters, the categories, who owns the actuals, and the numbers on the section rows. Everything else can stay as it is for the first month.
The template runs on two quarters because that's the horizon most marketing budgets are managed on. A six-week launch wants two fields, Planned and Actual, with one variance. A year-long program wants four quarters, so duplicate the Q3 and Q4 fields and add matching variance formulas.
Categories come from finance, not from the project. If the company budget has a line called Professional Services, your project has one too, even if you'd rather call it "the agency."
Then give every line a real owner, meaning a Quire assignee.
The weekly review only takes ten minutes if the Actual fields were updated by someone who knew the number.
The section rows deserve a decision too. In the sample, the figures on Brand & PR and the other category rows were typed in as targets, so they don't roll up from the lines beneath. Keep them as category targets you maintain yourself, or clear them, so the footer sum reads the lines alone.
Capital projects are their own discipline, with committed and spent as separate columns and lifecycle gates on every row. The capital project management guide covers that shape; this post stays with the ordinary project budget.
How often should you review a project budget?
Weekly, for about ten minutes, sorted by variance. Monthly reviews find out what happened. Weekly reviews still get a vote.
The ritual is short because the tool does the sorting. Open Table view, sort by the variance column, read the top three rows. For each red row, the owner answers one question: trim, draw on contingency, or re-plan the rest? The answer goes in a comment on the task, with a date.
Two rows deserve a look even when they're green. The contingency row, so a quiet draw doesn't become a habit, and any line that's been under for three weeks running, which is usually an invoice that hasn't arrived yet.
If the same two people own every red line, the budget problem is a load problem: the workload math post covers seeing that before it costs you a quarter.
A category that's red two quarters running has outgrown the word overrun.
The planned number is wrong, and the fix lives in the baseline rather than in the spend.

Key takeaways
A project budget drifts when spend is logged late, away from the work, with totals typed by hand. The fix is a baseline with an owner and a contingency row on every line, four numbers per line with forecast the one most teams skip, and a weekly ten-minute review sorted by variance.
A line that reads under for weeks is usually an invoice in transit. A category that's red two quarters running is a baseline problem.
Run it where the work already lives. The Quire Budget Allocation template puts planned and actual on each line as Custom Fields, flags the variance with a formula, and lays the quarter out in Table view with the sums in the footer.
Sign up for Quire, duplicate the template, and let the next review be a sort and a scroll instead of a reconciliation.
Frequently asked questions
What is project budget tracking?
Comparing what each spend line was allocated with what it has actually cost, often enough that an overrun is still cheap to fix. Four numbers per line, kept where the work is. In Quire they're Custom Fields on the task for that line.
What is the difference between planned, actual, and forecast cost?
Planned is the allocation. Actual is what's been spent or committed. Forecast is actual plus the remaining work at today's rate, and it's the earliest warning you get. The Budget Allocation template carries planned and actual per quarter with a variance that turns red on its own.
How often should you review a project budget?
Weekly, in about ten minutes, sorted by variance. Monthly is too late to change the outcome. In Quire's Table view the money columns sit side by side and the footer sums each one.
How much contingency should a project budget hold?
Start around ten percent and let your own variances adjust it. Make it a real row with a number, so every draw is a visible decision with a date. In Quire it sits in the same table as every other line.
Can you track a project budget in task management software instead of a spreadsheet?
Yes, and it tends to stay truer there. In Quire a spend line is a task, the amounts are currency Custom Fields, a formula flags the variance, and Table view lays the budget out like a sheet. The person doing the work updates the number where they already are.
How does project budget tracking keep a team productive at work?
It removes the reconciliation meeting. With planned, actual and variance on the work itself, nobody chases three versions of a spreadsheet, and the review becomes a sort by variance. Teams running their budget in Quire stay productive at work because the numbers, the tasks and the decisions live in one place.