project management · Apr 23, 2024
Unveiling Insights into Project Management Software and its Demographics

Last updated: July 10, 2026
Project management software adoption has clear patterns, nested task lists are the most-used view (Timeline and Kanban follow), North America and Europe lead adoption with Asia-Pacific growing fast, and solo users represent 46% of all PMS users (the largest single segment). Activity peaks in January thanks to New Year planning, with secondary spikes in March, April, and September around quarterly deadlines; November and December slow down as teams wind down for holidays.
- What Are the Most Used Views in Project Management Software?
- Which Continents Lead in Project Management Software Adoption?
- What Factors Matter Most When Choosing Project Management Software?
- What Team Size Typically Uses Project Management Software?
- How Do Teams Actually Use Project Management Software?
- When Are the Busiest and Slowest Months for Project Management Software?
- Frequently Asked Questions
Project Management Software (PMS) has become an indispensable tool for modern teams aiming to streamline their workflows, improve collaboration, and achieve project success. As the way teams manage projects keeps changing, so do the trends and insights surrounding PMS usage across different demographics.
In this blog post, we dig into some intriguing insights that shed light on various aspects of PMS usage, including popular views, geographical preferences, factors influencing choice, typical team sizes, usage purposes, and fluctuating activity levels throughout the year.
Quick reference: PMS adoption signals across dimensions
What Are the Most Used Views in Project Management Software?
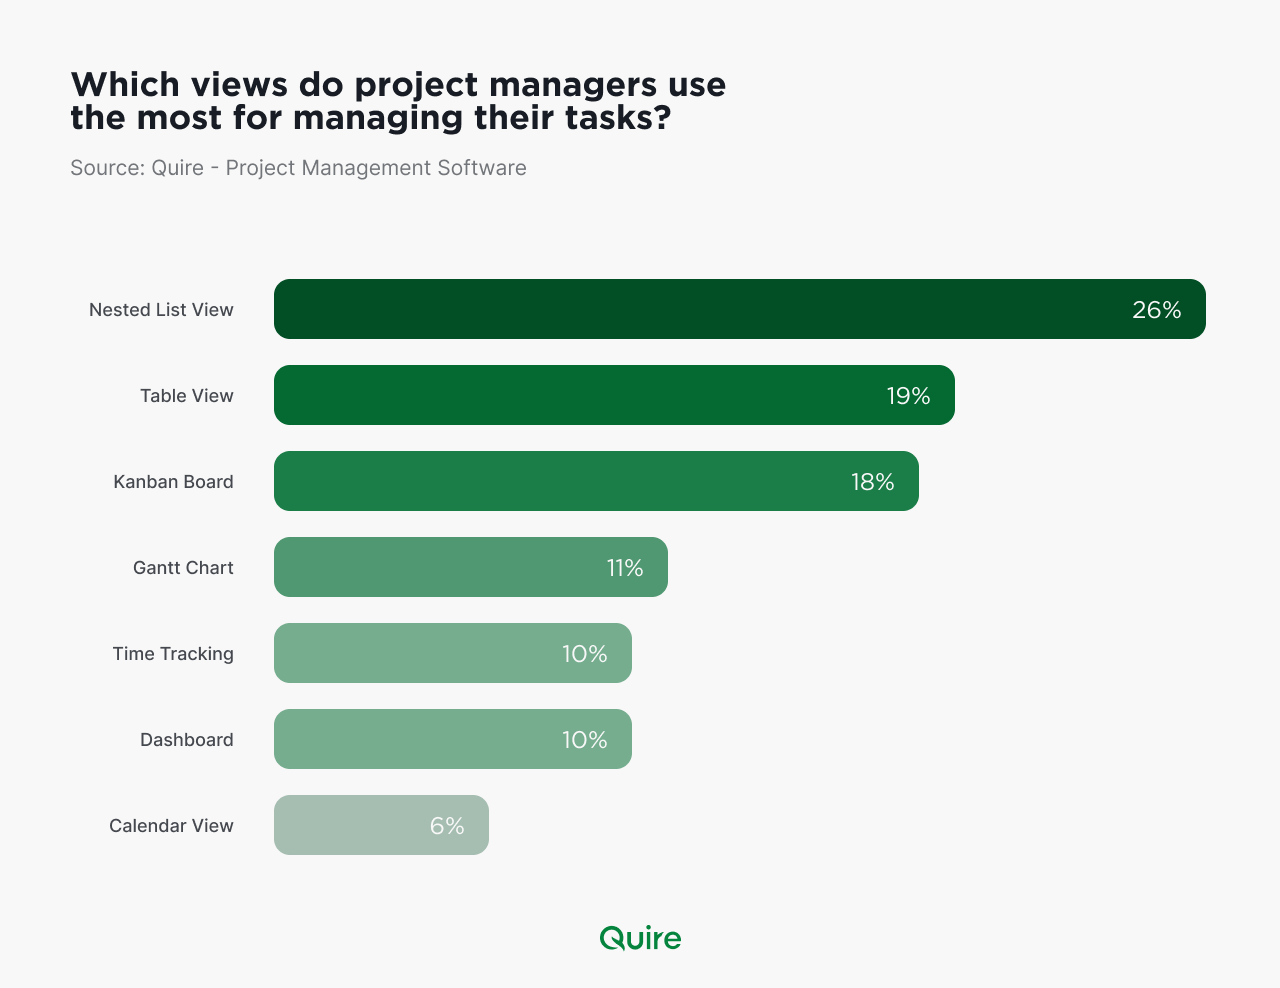
When exploring a Project Management Software (PMS), several views are commonly utilized by project managers and team members. Nested task lists, often the most adopted view, offer hierarchical organization for complex projects, ensuring clarity and task management efficiency. The Timeline view, renowned for its graphical representation of project timelines and dependencies, is a favored tool for planning and task scheduling.
Kanban boards, particularly popular among Agile teams, provide a visual snapshot of tasks at different stages, aiding in project progress tracking. Also, the task list view offers a detailed breakdown of all project tasks, facilitating prioritization and organization.
To enhance PMS functionality, time tracking features are essential, allowing teams to monitor project hours and improve productivity. The Table view provides a structured layout for data analysis and comparison, enhancing decision-making processes. Lastly, the Calendar view integrates project timelines with deadlines and milestones, offering a complete perspective on project schedules.
Which Continents Lead in Project Management Software Adoption?
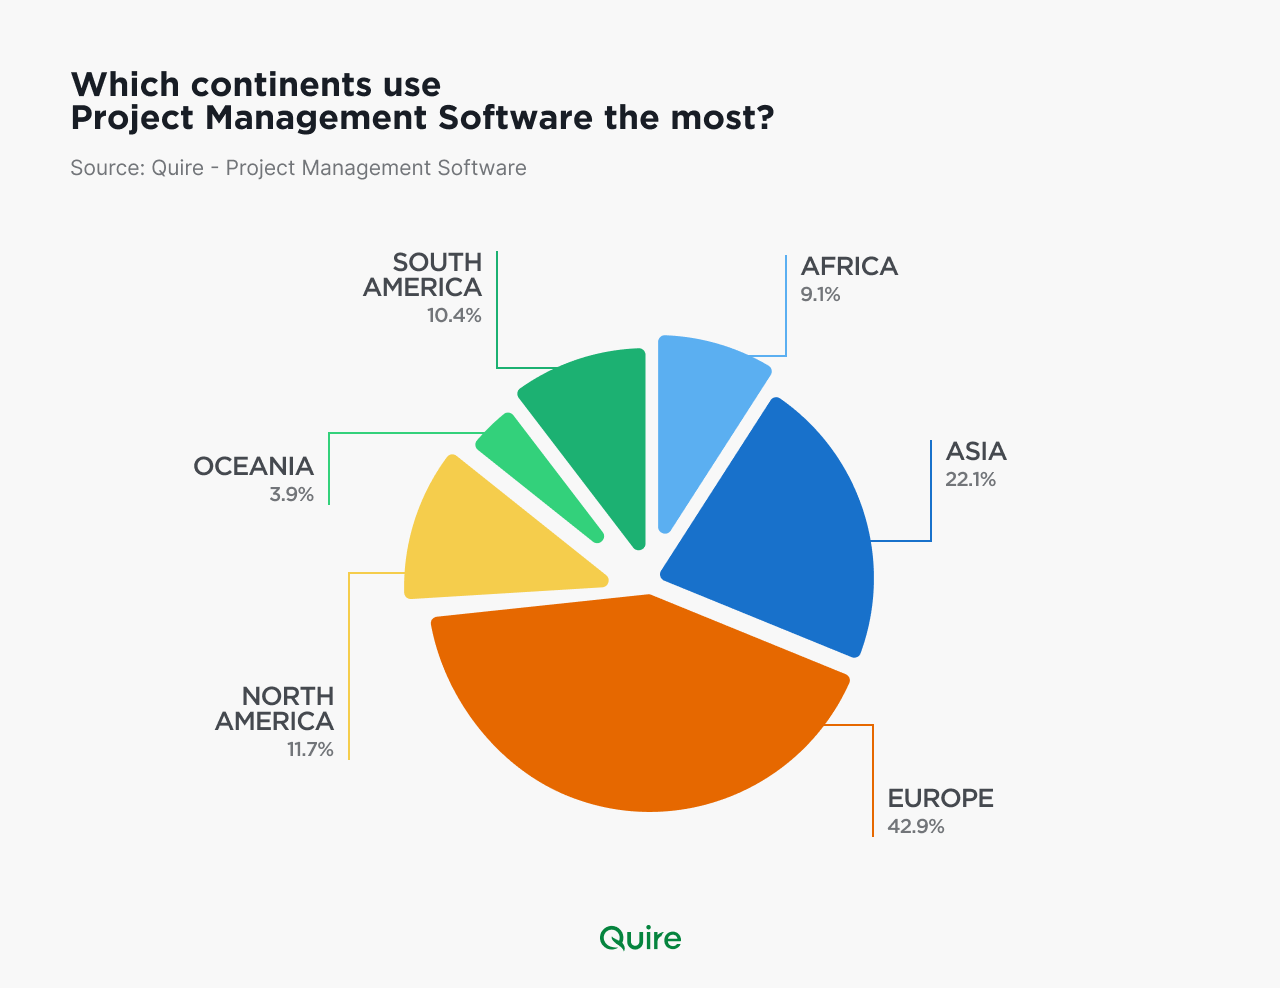
The adoption of PMS varies across continents, with certain regions showcasing higher usage rates than others. North America and Europe emerge as the leading continents in terms of PMS adoption, owing to their reliable tech infrastructure and a high concentration of businesses that prioritize efficiency through digital tools.
Asia-Pacific follows closely behind, with a rapidly growing number of organizations adopting PMS to simplify their operations and improve project outcomes. Africa and South America, while experiencing growth, still have untapped potential in terms of PMS adoption, presenting opportunities for software providers to expand their reach in these markets.
What Factors Matter Most When Choosing Project Management Software?
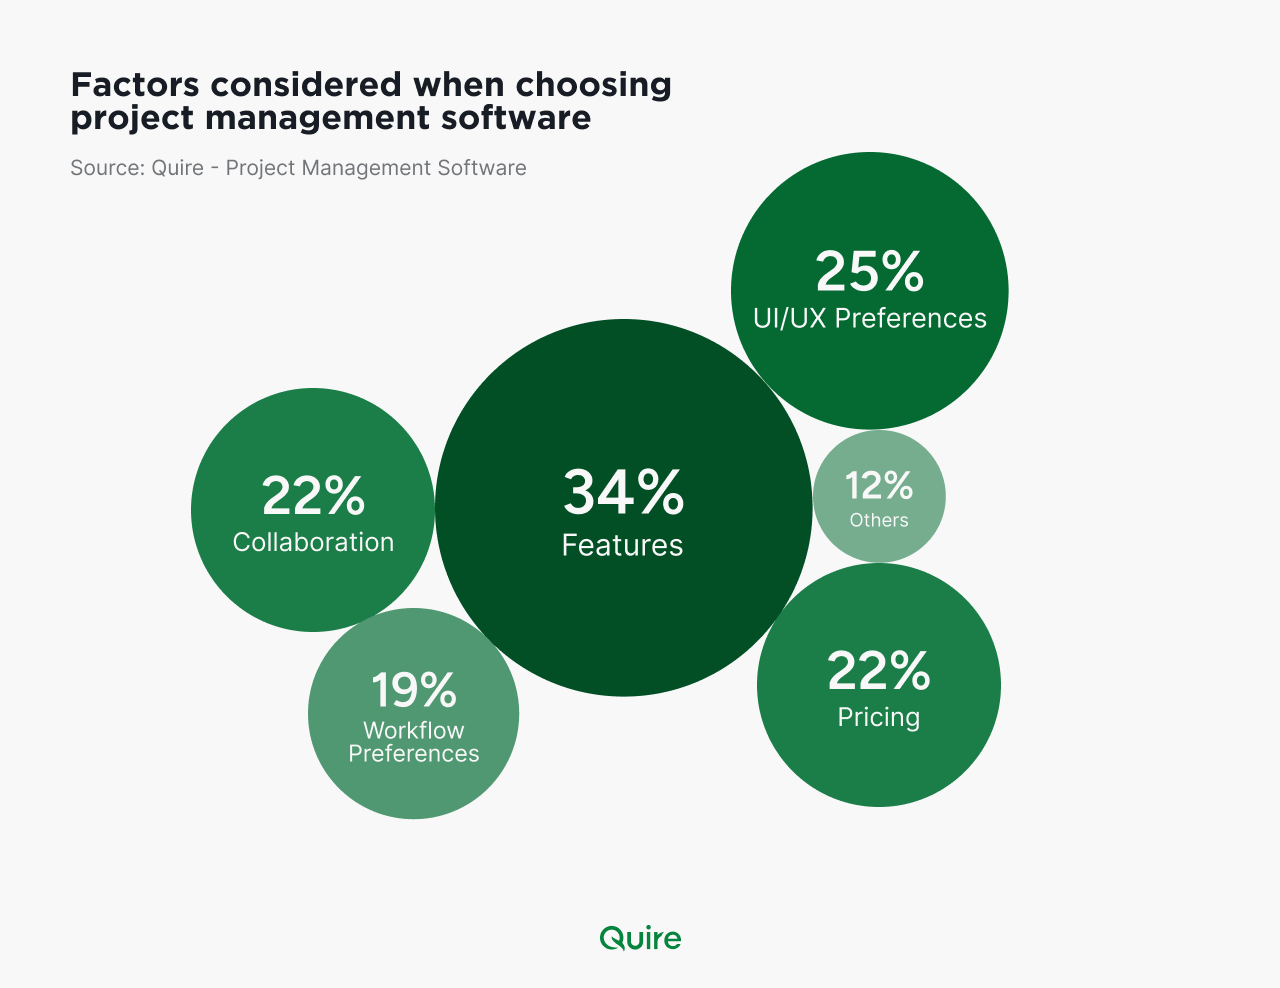
Selecting the right PMS involves careful consideration of several factors tailored to the unique needs of each team or organization. Key factors influencing choice include:
- Feature Sets: Teams assess the features offered by a PMS, such as task management, resource allocation, collaboration tools, reporting capabilities, and integration options, to ensure alignment with their project requirements.
- UI/UX Preferences: Intuitive user interfaces and ease of navigation are highly valued, as they contribute to user adoption and productivity. Teams often prefer software with customizable dashboards and visually appealing design elements.
- Collaboration: The ability of the software to facilitate smooth collaboration among team members, stakeholders, and external parties through features like real-time chat, file sharing, comment threads, and collaborative editing is a crucial consideration.
- Cost and Value: Balancing the cost of the software with its perceived value in terms of functionality, support, scalability, and return on investment weighs heavily in decision-making. Teams evaluate pricing plans, licensing models, and additional costs for integrations or add-ons.
- Workflow Preferences: The software's compatibility with existing workflows, methodologies (e.g., Agile, Waterfall), and project management frameworks is essential for ensuring smooth integration and minimal disruption to established processes.
- Others: This category encompasses additional factors such as customer support quality, training and onboarding resources, security features, compliance with industry standards, mobile accessibility, scalability for future growth, and user reviews or recommendations from peers in the industry. These miscellaneous factors can influence the overall decision-making process and enhance the software's suitability for specific project management needs.
Read more on 6 essential courses to enhance your project management skills.
What Team Size Typically Uses Project Management Software?
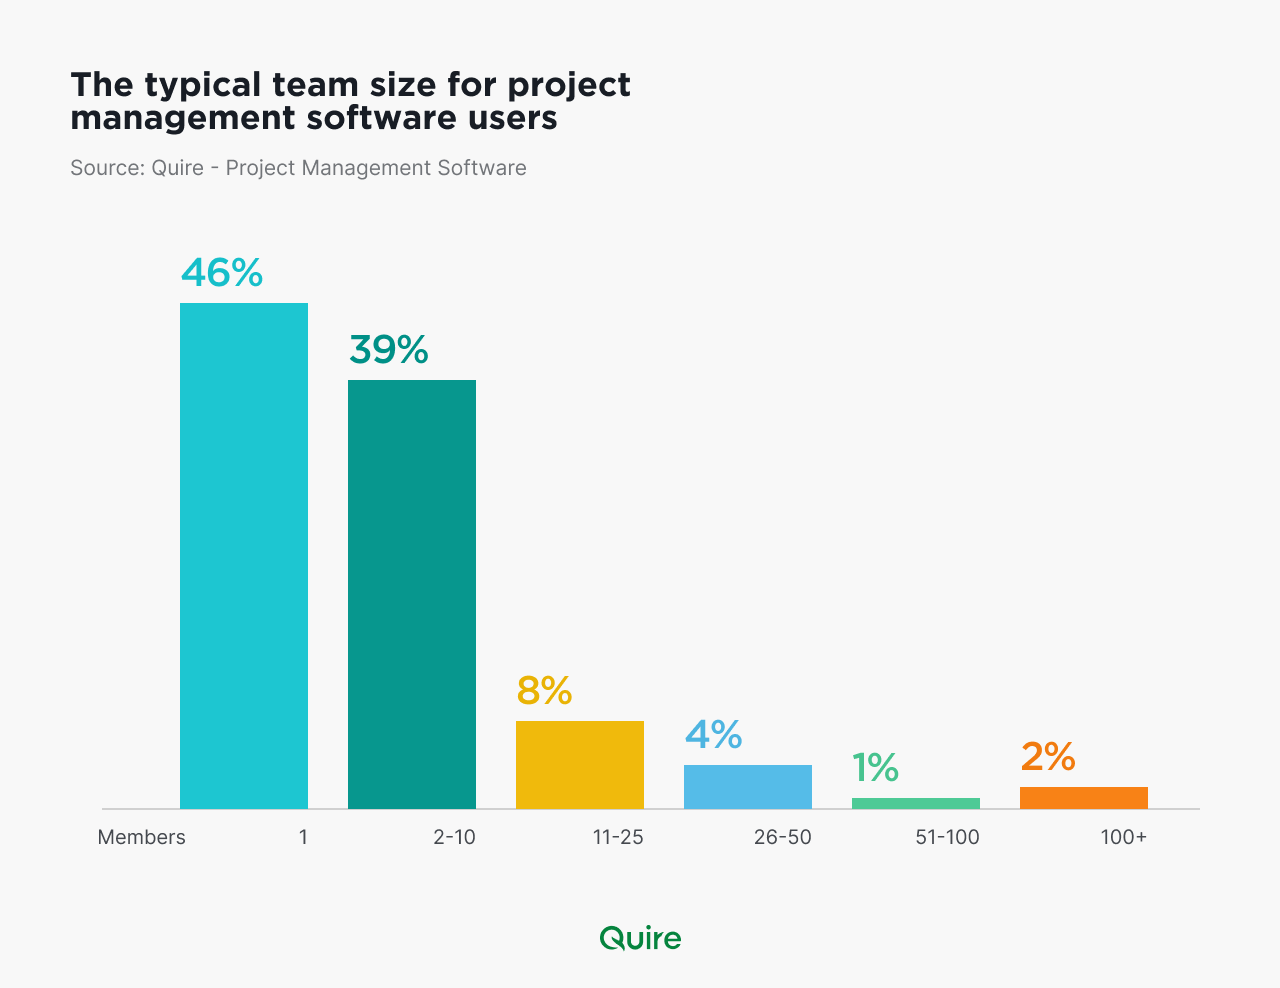
The ideal team size for PMS users varies depending on the scope and complexity of projects. Surprisingly, solo flyers take up to 46% of the typical team size for project management software users. Small teams comprising 5 to 10 members often find PMS beneficial for enhancing communication, task tracking, and overall project visibility.
Medium-sized teams ranging from 10 to 50 members rely on PMS to coordinate activities, allocate resources efficiently, and maintain project timelines. Large teams with 100+ members use PMS for complete project management, collaboration across departments, and handling multiple projects concurrently.

How Do Teams Actually Use Project Management Software?
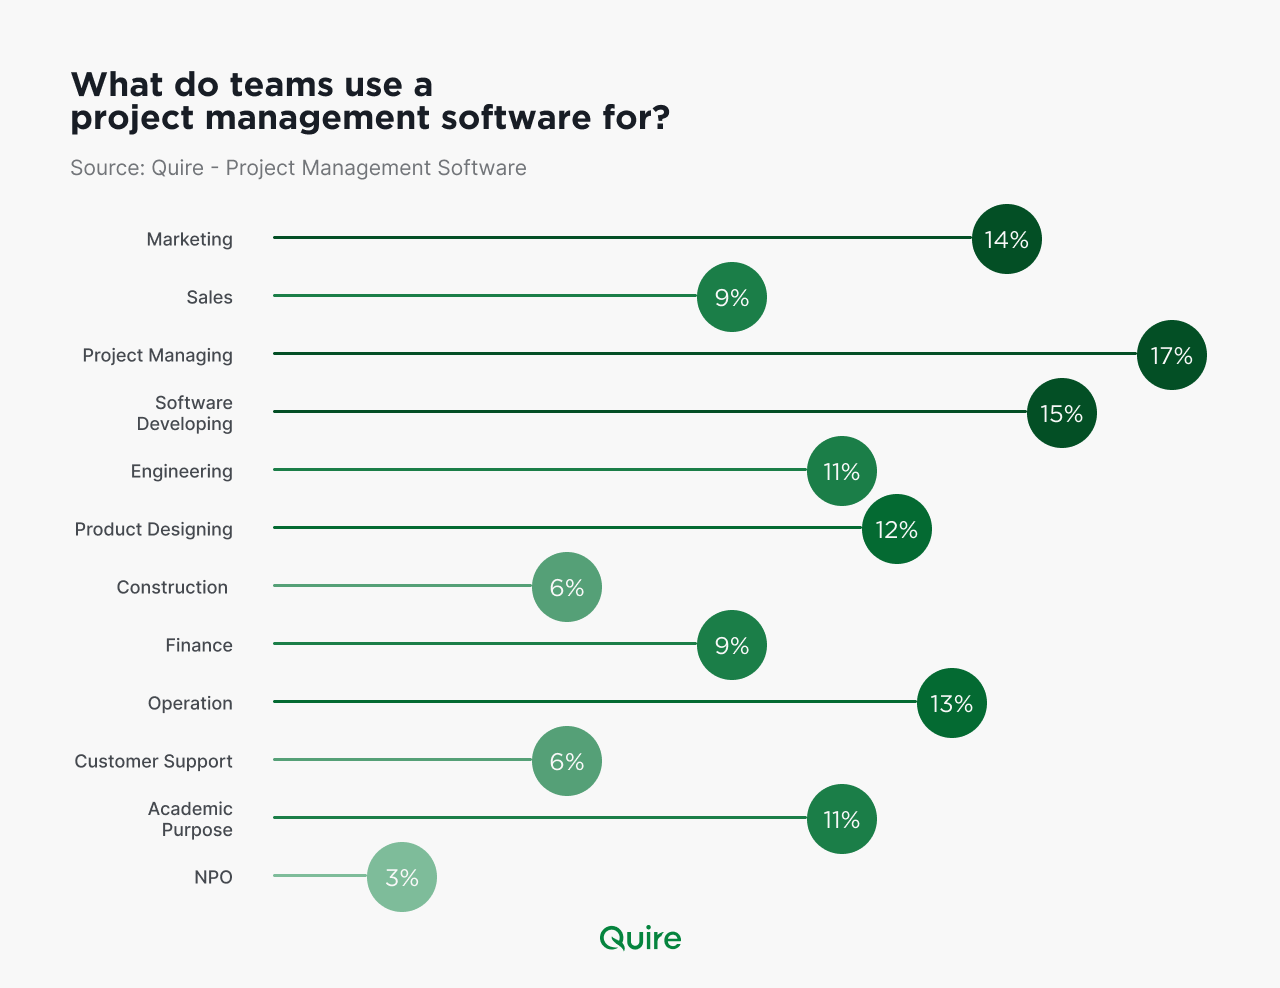
Teams utilize PMS for a multitude of purposes, including:
- Marketing/Sales: Teams in marketing and sales departments use PMS for campaign planning, lead management, sales pipeline tracking, customer relationship management (CRM), and analyzing market trends.
- Project Managing: Project managers use PMS for task allocation, timeline management, resource planning, risk assessment, progress tracking, and stakeholder communication.
- Software Developing: Software development teams utilize PMS for agile project management, sprint planning, bug tracking, code repositories integration, version control, and continuous integration/continuous deployment (CI/CD) workflows.
- Operations: Operational teams rely on PMS for inventory management, supply chain coordination, production scheduling, quality control, logistics tracking, and process optimization.
- Engineering: Engineering teams use PMS for designing workflows, managing technical specifications, tracking equipment maintenance, conducting feasibility studies, and coordinating interdisciplinary projects.
- Product Designing: Design teams utilize PMS for creating design briefs, managing design iterations, collecting feedback from stakeholders, version control for design files, and collaborating on prototypes.
- Finance: Finance departments use PMS for budgeting, expense tracking, financial reporting, forecasting, invoicing, vendor management, and compliance with regulatory standards.
- Academic Purpose: Educational institutions and research teams use PMS for managing academic projects, collaborative research efforts, scheduling classes/seminars, grading assignments, and tracking student progress.
- Others: This category encompasses various industries and use cases such as healthcare (patient care coordination), construction (project planning and resource allocation), event management (event planning and logistics), nonprofit organizations (grant management and fundraising projects), legal firms (case management and client communication), and consulting firms (client engagements and deliverable tracking). These diverse applications highlight the versatility of PMS across different sectors and functions.

When Are the Busiest and Slowest Months for Project Management Software?
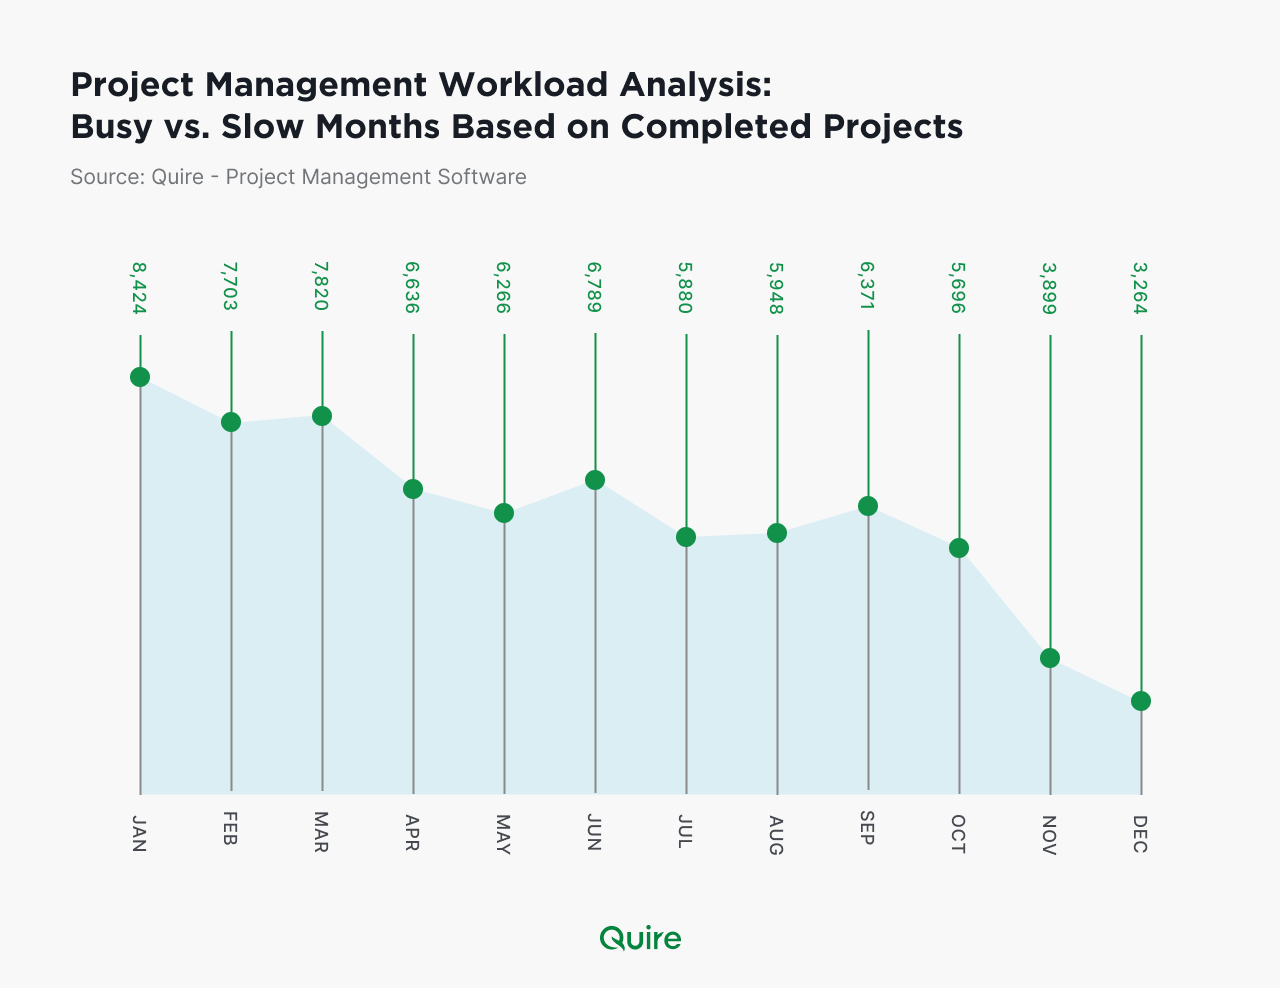
The activity levels within PMS often exhibit fluctuations throughout the year, with distinct slow and busy months influenced by various factors:
Slow Months: Typically observed during holiday seasons, such as November and December, when many teams experience reduced workloads due to vacations and festive breaks. However, some industries, such as retail or event management, may have busy periods during these months.
Busy Months: Commonly seen in the months leading up to major industry events, product launches, or end-of-quarter deadlines when teams intensify their project activities to meet objectives and timelines. For instance, March, April, and September often witness heightened PMS usage as teams strive to achieve quarterly goals. January has the highest peak since it’s the time for the “New Year, New Me” resolution.
Over the last decades, Project Management Software continues to revolutionize how teams collaborate, plan, and execute projects across various industries and demographics.
Understanding the nuances of PMS usage, including preferred views, geographical trends, decision-making factors, team sizes, utilization purposes, and activity fluctuations, equips organizations to make informed choices and optimize their project management strategies for success.
More project management reads: Project Managers and Crisis: How They Help Organizations Bounce Back and 6 Expert Secrets for Exceptional Project Team Leadership.
Frequently Asked Questions
What are the most used views in project management software?
Nested task lists lead adoption, followed by timeline and Kanban views. Table and calendar views round out the picks for data-heavy and schedule-driven teams.
Which continents lead in project management software adoption?
North America and Europe lead, with Asia-Pacific close behind and growing fast. Africa and South America are emerging markets with room to expand.
What factors matter most when choosing project management software?
Features, UI/UX, collaboration, cost, and workflow compatibility top the list. Support, security, and scalability usually tip the final decision.
What team size typically uses project management software?
Solo users make up about 46 percent of the base, the largest single group. Small and medium teams use it for coordination, while large teams rely on it for cross-department visibility.
When are the busiest and slowest months for project management software usage?
January peaks thanks to New Year planning, with March, April, and September also busy around quarterly deadlines. November and December tend to be the slowest months.
