features · Jul 27, 2026
Introducing Dashboard View: Your Project at a Glance, Built Your Way
Last updated: September 30, 2026
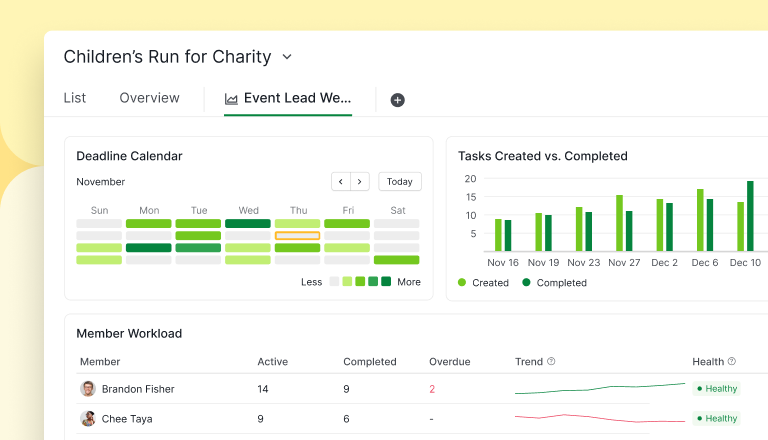
Quire Dashboard View lets you build your own project dashboards from a library of widgets, task lists and charts you arrange to fit how you work. Keep one private for your morning triage, or share one with your team so everyone reads from the same screen. It lives right next to your project's shared Overview, which got a widget-based refresh of its own.
You open your project on Monday with one small question: are we okay? So you check the board to see what's moving. Then the calendar for this week's deadlines. Then a teammate's task list to work out why the design review keeps slipping. Fifteen minutes later you've got seven tabs open and a slightly worse mood.
You're not doing it wrong. The information just lives in a lot of places, and you're the one stitching it back together every morning.
That stitching has a measurable price, too. A Harvard Business Review study of 137 workers at three Fortune 500 companies found that people toggled between apps and windows nearly 1,200 times a day and spent just under four hours a week simply reorienting themselves after switching, roughly 9% of their time at work.
That's the whole reason we built Dashboard View. It's a screen you put together yourself, from the pieces you actually care about, so the answer to are we okay? is already sitting there when you open it.
Dashboard View is available on Professional plans and higher. The revamped Overview tab is on every plan, including Free. Full details are on our Pricing page.
What Is Dashboard View?
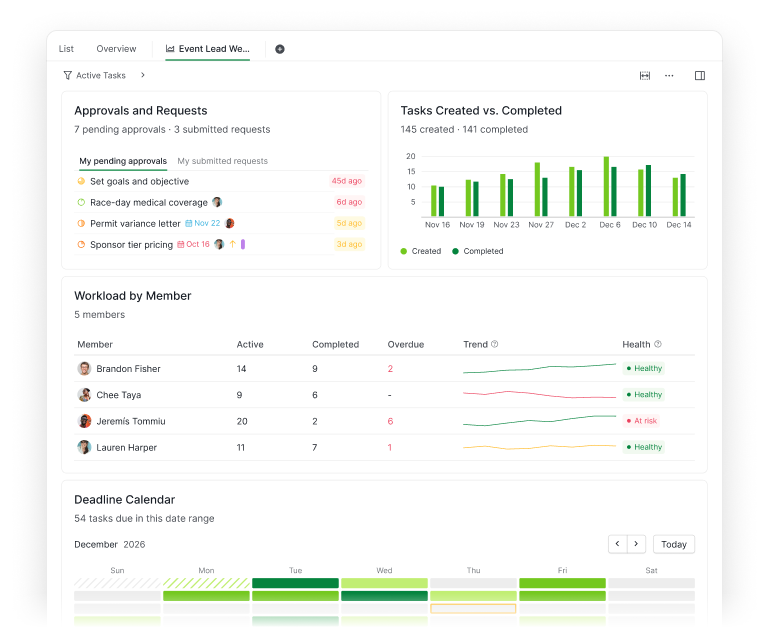
Dashboard View: a Quire view where you build your own project dashboard from a library of widgets, task-list panels and charts you arrange, filter, and either keep private or share with your team.
Every Quire project already has an Overview tab, and it just got rebuilt too (more on that shortly). It's the shared snapshot of project health that everyone sees, the one steady place the whole team reads from.
The trouble with a single shared screen is that everyone wants something slightly different on it. Your team lead wants workload. You want your own overdue tasks. Someone in finance wants a completion trend. Pile all of that onto one page and it stops being useful for anyone.
Dashboard View solves that by giving you a second surface. Overview stays put as the team baseline. Dashboards are the canvases you build on top of it, arranged from a library of widgets, and you decide whether each one stays private or gets shared.
Here's the part that makes it click: a Dashboard takes on the scope of wherever you create it. Build one inside a single project and it's all about that project. Build one at the Folder, Smart Folder, or Organization level and it can pull in work from many projects at once. The library quietly hides any widget that doesn't fit, so you never add a "per-project" chart to a place that only has one project.
New to the idea? Read what a project dashboard is and why you need one.
What Widgets Can You Add? The Widget Library
Open the widget library and the first thing you'll notice is that it doesn't dump fifty options on you.
It opens on Recommended, a short list of widgets picked for your role, so a team lead sees things like member workload and at-risk tasks, and an individual contributor sees their own attention list.
From there you can browse the rest by tab: My Work for your own tasks, Tasks for task-list widgets, Members for tracking people and workload, Projects for the cross-project picture, and All when you already know the widget's name.
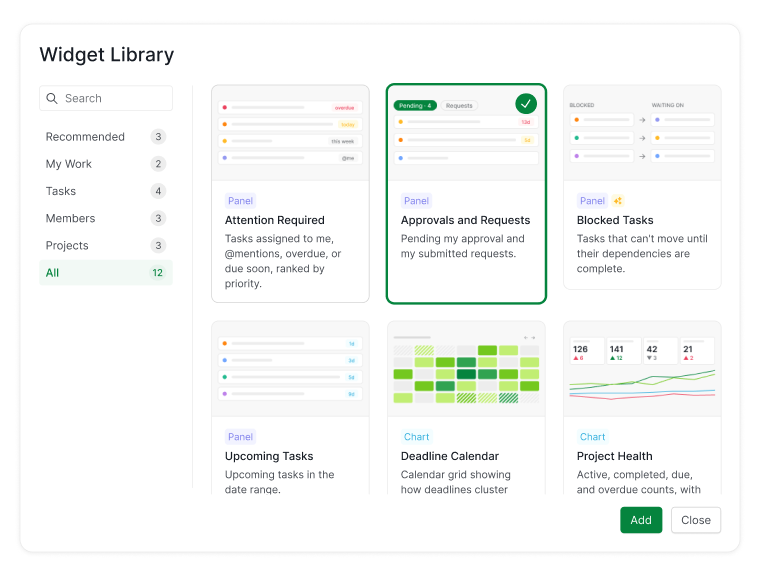
Widgets come in two flavors. Panels are task lists. Attention Required gathers what needs you today: overdue tasks, things due this week, and places you were mentioned, ranked by urgency. Approvals and Requests shows what's waiting on your sign-off and where your own requests stand. There's also Blocked Tasks, Upcoming Tasks, and Member Workload, among others.
Charts are the visual side. Portfolio Health gives you active, completed, due, and overdue counts with a trend. Task Status Distribution shows the split across your statuses. Deadline Calendar lays out how your due dates cluster across the weeks. Tasks Created vs. Completed answers the quietly important question of whether you're shipping work faster than it arrives.
Every widget has a small "..." menu to rename, resize, duplicate, or remove it, plus its own filters for status, priority, assignee, tags, and dates. And when you want the whole board to speak about one thing, a Dashboard-wide filter lets every widget follow along, until you tell one to go its own way.
Curious about the charts themselves? See Introducing Charts in Quire, and the data-summary side in Insight View.
What Changed in Your Overview Tab?
These widgets don't only live on the Dashboards you build. The Overview tab every project, folder, and organization already has was rebuilt around the same set, and it's scope-aware: no setup, just the right widgets for wherever you're looking.
Organization and Project Overview
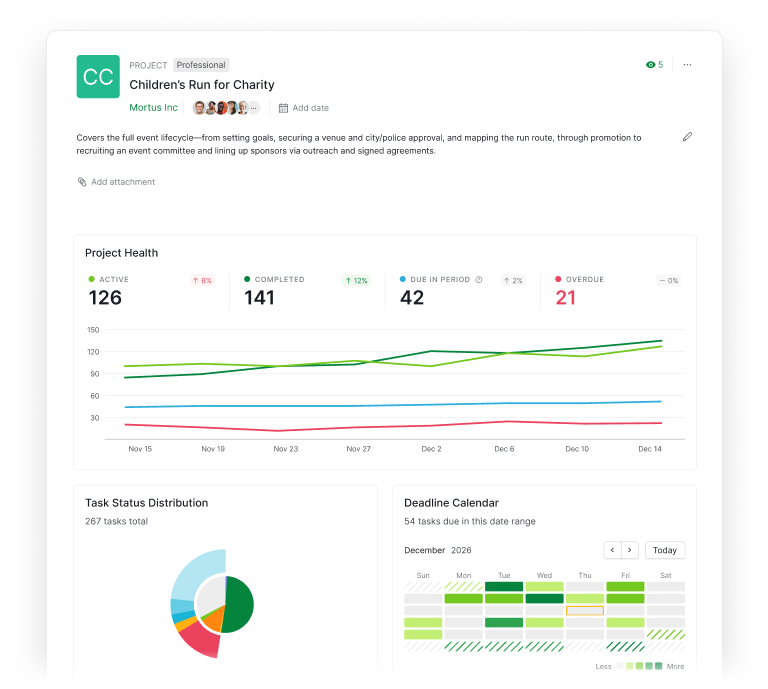
A project's Overview opens on that project's health: Project Health (active, completed, due, and overdue, with a trend), Task Status Distribution, a Deadline Calendar, and Member Activity. An organization's Overview zooms out to the whole portfolio, where Portfolio Health and Member Workload show which projects and people need attention, next to a Deadline Calendar that spans every project.
Folders and Smart Folders
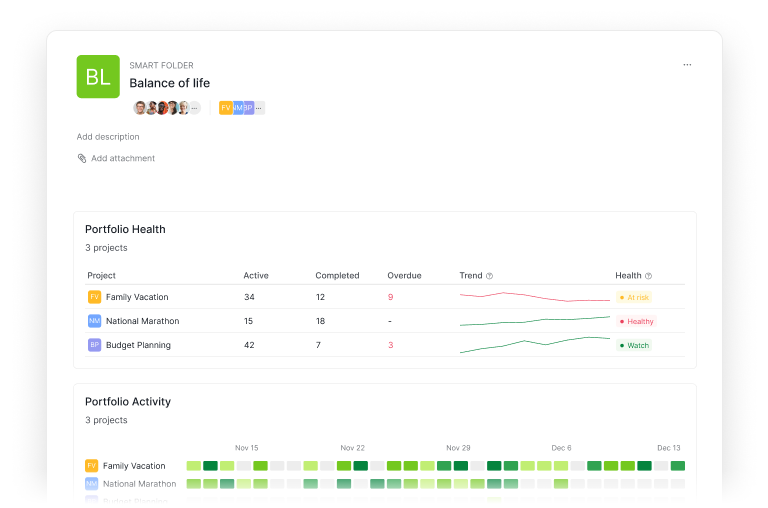
Folders and Smart Folders sit in between, so their Overview is cross-project: Portfolio Health, Portfolio Activity (which projects are busy, which have gone quiet), and a shared Deadline Calendar. The difference is reach. A Folder groups projects inside one organization; a Smart Folder gathers them across organizations, so an agency lead or department head sees the whole group without opening each project.
My Tasks Overview
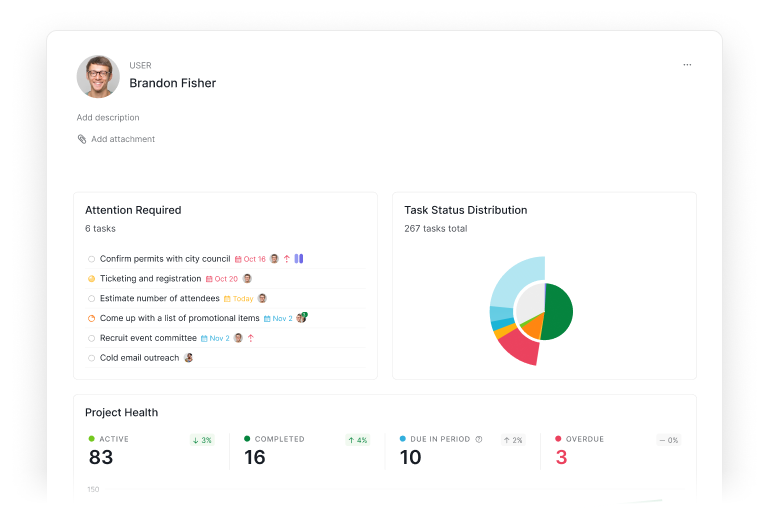
Your My Tasks Overview is the personal one. Attention Required sits up top, everything overdue, due this week, or where you were tagged, ranked by urgency, so you know what needs you the moment you log in. Below it, Task Status Distribution, Project Health, and Project Activity roll up across every project you're part of.
So the two surfaces split the work: Overview is the automatic, shared baseline; Dashboards are the custom layer. Same widgets, two jobs.
What Are 3 Practical Ways to Use Dashboard View?
The fastest way to understand a blank canvas is to watch a few people fill it in. Here are three Dashboards that come together in about a minute each.
1. Your Monday-morning triage
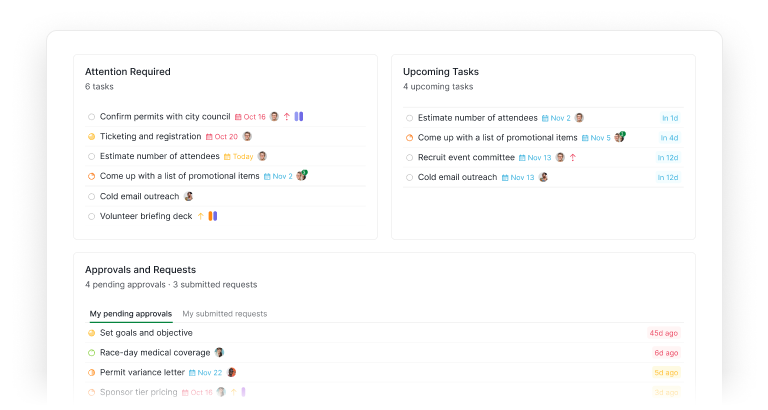
This one's private, and it's the one you'll open most.
Add three widgets: Attention Required, Upcoming Tasks, and Approvals and Requests. Now the first thing you see each morning is what's overdue, what's landing this week, and what's sitting in your court waiting for a yes or no. No clicking into four projects to reconstruct your own day.
Take a content writer juggling six live pieces. Her Attention Required panel surfaces the two posts that are overdue and the mention where an editor asked for a change. Her Approvals panel reminds her the January newsletter is still waiting on her sign-off, since Quire's task approvals feed right into it. On a good day, the panel just tells her she's caught up, and honestly, that little message is worth the whole setup.
2. A team lead's weekly read
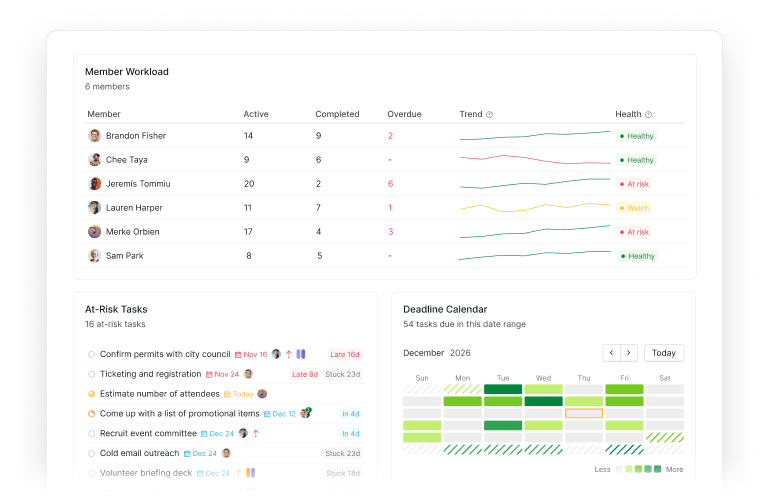
Switch to the Members tab and this Dashboard almost builds itself.
Member Workload shows each person's active, completed, and overdue counts, plus a simple health signal, so you can see who's underwater before they say a word. At-Risk Tasks flags the work most likely to slip its deadline. Deadline Calendar spreads the week's due dates out so a Thursday pileup is obvious on Monday, using the same clustering idea behind Quire's Smart Calendar, scoped down to a single widget.
A team lead running a product sprint keeps exactly these three. Fifteen seconds tells him whether anyone's overloaded, which two tasks need a nudge today, and whether Friday is quietly turning into a cliff. He rebalances before it becomes a fire, not after.
3. The cross-project, portfolio picture
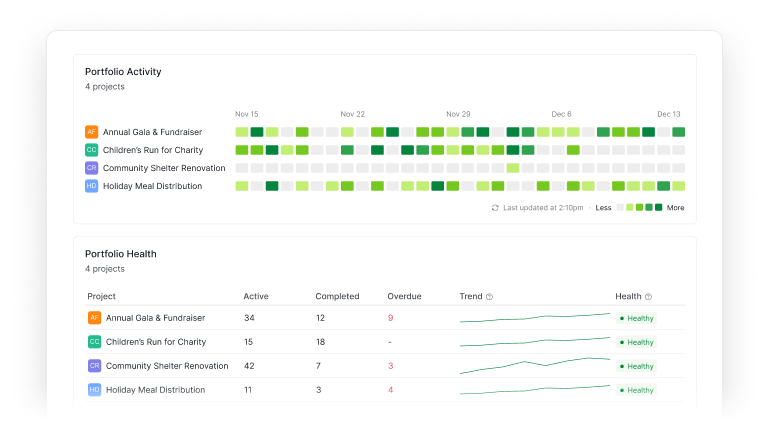
Build a Dashboard at the Folder or Organization level and a new set of widgets shows up, the ones that only make sense when you're looking at more than one project.
Portfolio Health gives you each project's active, completed, and overdue counts side by side, with a health signal per project. Portfolio Activity shows daily task activity across projects, so a stalled project stands out from a busy one. This is the Dashboard for anyone whose job is "how's everything doing," an agency lead across client accounts, a head of ops across teams, a founder who just wants one honest screen.
If your work spans separate organizations, Smart Folders let a cross-org Dashboard gather it all into one place.
How Does Dashboard View Keep a Team Aligned?
Alignment usually breaks in a boring way. Not big disagreements, just everyone looking at a slightly different version of the truth. One person's tracking the sprint board, another's living in email, a third swears the deadline moved.
Dashboard View helps because it separates the shared story from the personal one, on purpose. Overview stays the common ground, the health view nobody has to rebuild. Your private Dashboards are yours to fiddle with as much as you like. And a shared Dashboard becomes the agreed screen for a specific job, the sprint, the launch, the client, whatever the team decided to watch together.
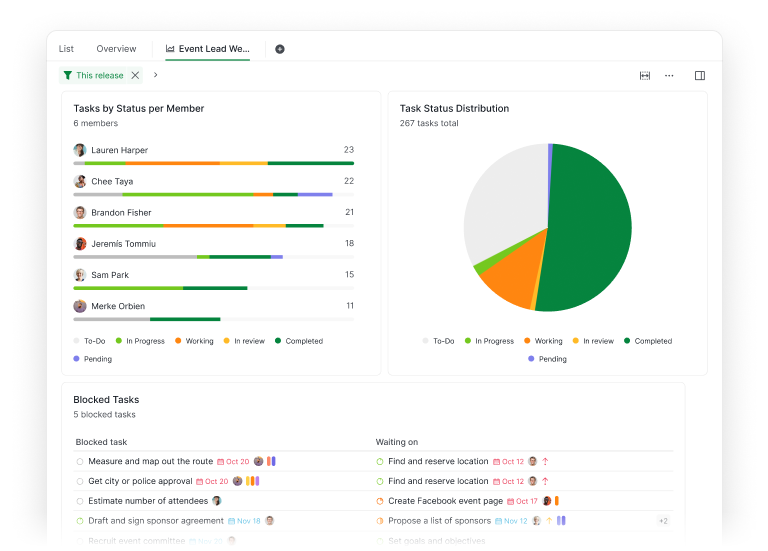
The Dashboard filter is the quiet hero here. When a shared board is filtered to "this release" and every widget follows along, there's no arguing about scope, because everyone reading that Dashboard is looking at the same slice. If one widget needs a different cut, you can still give it its own filter instead of the shared one, the same per-widget override described above.
That's the balance we were after. A team baseline that stays steady, and personal space that flexes, without the two stepping on each other.
Give It a Home on Your Monday
You don't need to plan the perfect Dashboard. That's the nice thing about a canvas: you can be wrong on it cheaply.
So here's a small first move. Open a new Dashboard, add the three widgets you check most often, and give them names you'll actually recognize. Live with it for a week. Add one, drop one, share it if it starts feeling useful to more than just you.
Want the step-by-step? Quire's Dashboard guide walks through creating a Dashboard, adding widgets, and setting each one up in detail. This post is the quick tour; the guide is the manual.
Dashboard View is here to hand back the fifteen minutes you spend every morning stitching the picture together. Your revamped Overview is waiting on every plan, so open it to see the new widgets. And on Professional and up, add a Dashboard and make the first one yours.
So, what are the first three widgets going on yours?
Key takeaways
- Dashboard View lets you build your own project dashboard from a library of widgets, task-list panels and charts, on Professional plans and higher.
- Overview stays the automatic, shared baseline on every plan, including Free, now rebuilt scope-aware around the same widgets.
- A Dashboard inherits its scope: build it inside a project for that project, or at Folder, Smart Folder, or Organization level for a cross-project view.
- The widget library groups everything under Recommended, My Work, Tasks, Members, Projects, and All, and leads with picks for your role.
- Keep a Dashboard private for your own triage or share it with the team, and use the Dashboard-wide filter to keep every widget on the same slice.
- Start small: three widgets, one week, then add, drop, or share based on what you actually open.